Introduction
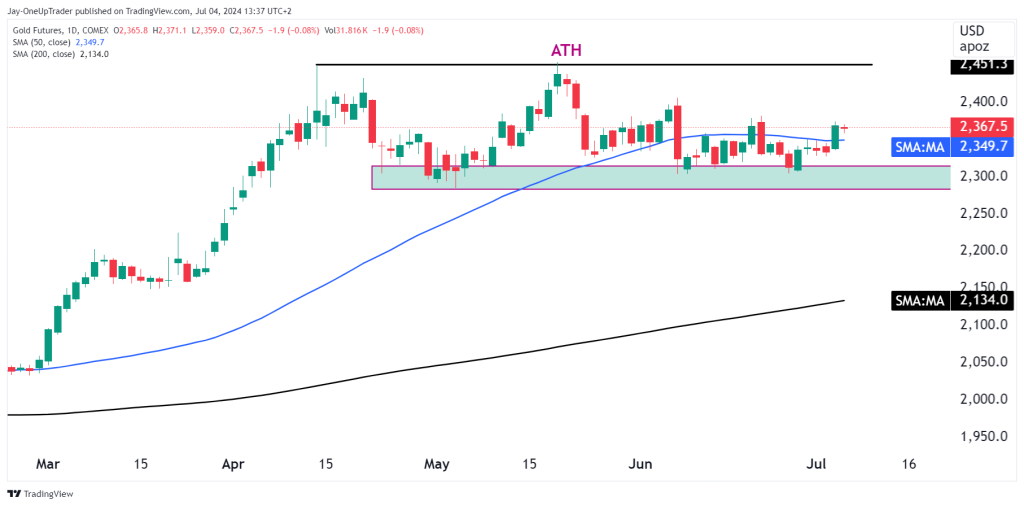
Gold Futures (GC) are still performing well in 2024, up 14.2% YTD and 22% for the past 365 days. The main observations we can look at is the huge divergence between the 50 and 200 SMA. The 200 is steadily rising so long term investments and trades point bullish.
At the moment, GC is below the ATH, but not by a lot; this current consolidation phase is typical after a strong uptrend, which we saw back in March. Lets take a look at some aspects of the chart to help us with trade opportunities.
Daily Chart
Support Zone: The support zone between $2,300 and $2,350 has been a critical area where buyers have consistently stepped in to support prices.
Moving Averages: The 50-day Simple Moving Average (SMA) at $2,349.7 and the 200-day SMA at $2,134.0 have a huge gap between them showing a strong bullish momentum in the short term.
Recent Price Action: The price recently bounced off the support zone and is currently at $2,366.9, indicating a potential continuation of the uptrend after the consolidation.
Trade Opportunities
Long Position
- Entry: Consider entering a long position if the price sustains above the 50-day SMA ($2,349.7).
- Target: The initial target could be the ATH at $2,451.3. If the price breaks above this level, the next target could be set around $2,500.
- Stop-Loss: Place a stop-loss below the 50-day SMA, around $2,340, to manage risk.