


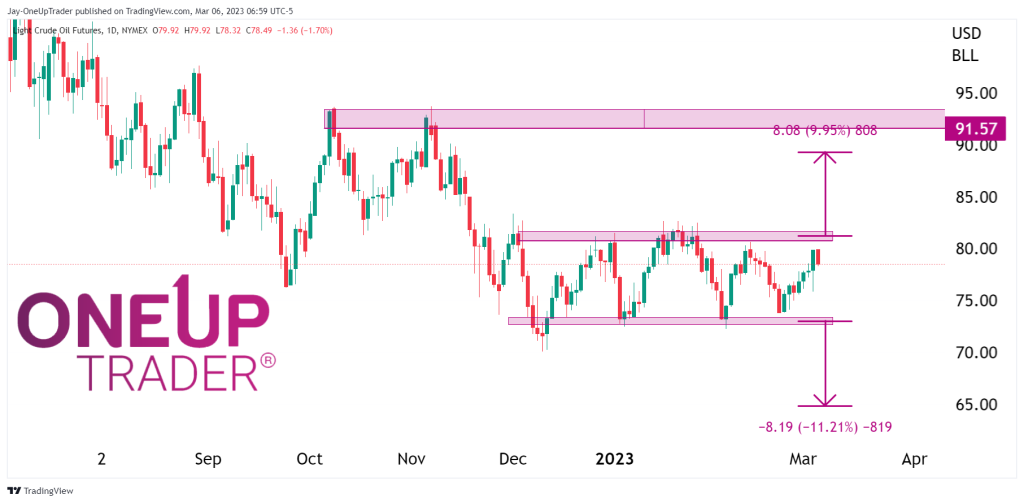
- Looking at the recent price action in CL.
- There are trade opportunities for a range-bound trade and a breakout trade.
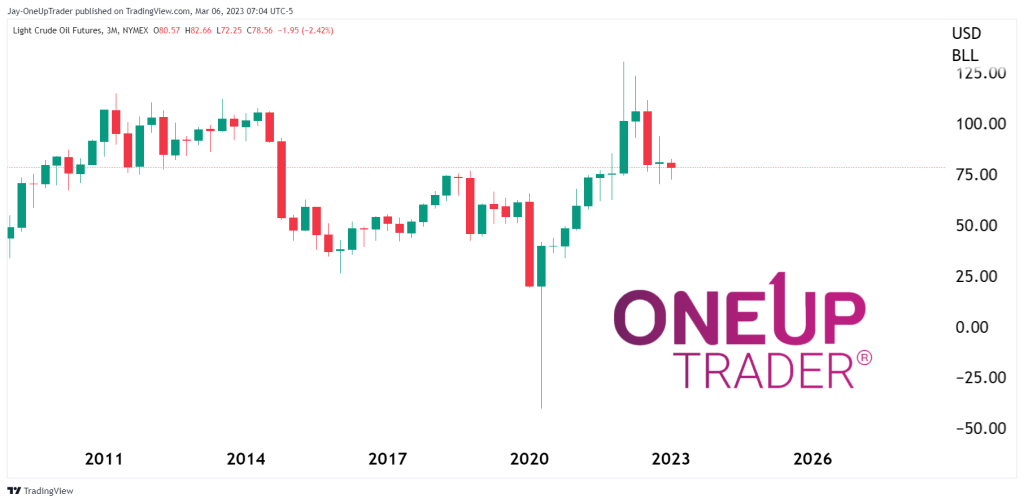
- Spinning top spotted on the 3-month chart and what it means for the rest of the year.
Overview
Crude has been a range trader’s dream as black gold remains within a tight 5 Dollar range between $75 and $80 per barrel. If the Dollar continues to rally on the back of strong US data and continued US interest rate hikes, we could see CL break below the range.
There are a few ways to play this at the moment. Let’s list them:
Range trade
The range-bound trade continues to buy the low of the range and begin exiting the position as price rallies back to the top side, and vice versa for going short. The appealing part of this strategy is as long as the range remains, the risk is defined as below the low of the range and above the high. Traders who, for example, buy the low of the range to later find CL rally can leave one or two contracts open as it approaches the top side with the potential of a bullish break.
Breakout trade
The breakout trade is one where traders set a buy stop above the high of the range and a sell stop below the low as price breaks out in either direction. Profit targets would be a minimum of the length of the range, which would equal a $5 move. That would yield $5,000 per contract.
It is a simple trade because it can be placed and forgotten about, with traders only having to check a few times a day to see if the orders have been filled.
Traders can do the same at the top of the range and short it.
Quarterly chart
The quarterly (3 month chart) shows an interesting candlestick pattern in the form of a spinning top from the close ending on January. With the next close a month away, the bulls have kept the price up thus far, signalling that they may be in the driving seat for the remainder of 2023. Time will tell.