

Price Snapshot (as of May 6, 2025):
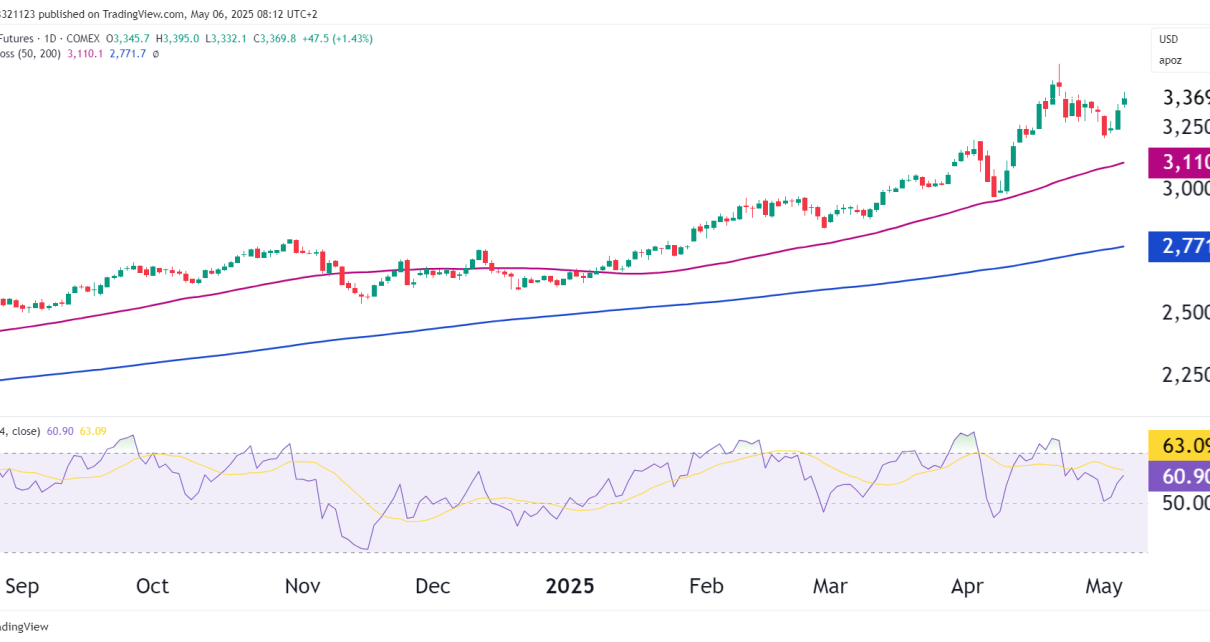
- Current Price: $3,369.80
- YTD Performance: +45%
- Trend Structure: Bullish continuation
- RSI (14): 60.90 – Momentum regaining strength

Technical Analysis
Trend
- Gold remains in a confirmed primary uptrend, well above both 50-day and 200-day moving averages, with price accelerating sharply since late February.
- Price remains in “blue sky territory” — no overhead resistance on the chart.
Moving Averages
- The 50-day MA ($3,110) is acting as dynamic support; the last test resulted in a decisive bounce.
- The 200-day MA ($2,772) remains far below price — confirming strong long-term bullish positioning.
- Golden cross occurred months ago and continues to underpin the macro trend.
RSI Momentum
- RSI at 60.90 shows momentum cooling slightly from overbought, but today’s rise and reversal off the 50 level reinforces renewed bullish strength.
- RSI remains well below extreme levels, suggesting room to the upside.
Key Price Levels
| Type | Level | Notes |
|---|---|---|
| Support | $3,110 | 50-day MA & breakout pivot |
| Support | $3,000 | Psychological round level |
| Resistance | None | Blue sky breakout |
| Extension | $3,500–3,650 | Measured move from breakout flag |
Why Is Gold So Strong?
Drivers Behind Gold’s Outperformance
- US Dollar weakness: After peaking near 105, DXY has broken down toward 99–100.
- Rate cut bets return: Weak ISM data and easing inflation reignited Fed dovish sentiment.
- Geopolitical risk: Ongoing tensions (Taiwan, Middle East) are lifting safe-haven demand.
- Central bank demand: Record purchases continue from China, India, and emerging markets.
- Real yield stagnation: Despite sticky inflation, real yields are compressing due to Fed pivot expectations.
Bear Case?
- Overextension risk: 45% YTD is extraordinary — even bullish markets breathe.
- Yield rebound or Fed hawkish turn could cap gains or lead to a quick pullback.
- Any strong dollar reversal would likely pressure gold short term.
Outlook Summary
| Term | Bias | Comment |
|---|---|---|
| Short-term | Bullish | Breakout retest successful; RSI supportive |
| Medium | Bullish | Structural support from MAs + macro tailwinds |
| Long-term | Strong Bullish | Gold remains in a multi-decade breakout regime |
Final Take
Gold’s breakout rally has regained steam, and today’s surge validates the bullish continuation. While some consolidation could occur above $3,300, the technicals suggest a likely push toward $3,500–$3,650 next.
As long as price holds above the $3,100 pivot and the macro narrative of dollar softness + geopolitical fear + Fed policy shift remains intact, gold remains one of the strongest trending assets of 2025.
