- Technical analysis: GC showed signs of being overbought, trading at the top of an upward-sloping channel, indicating a potential bearish trend.
- Trade ideas: The chart suggests a higher probability for long trades, with a stop below recent lows at $1,936 and initial targets starting at the point of control (POC) line at $2,000.
- Key points: 100-day moving average at $1,949 signals a positive trend, while minor support at $1,959.8 may prevent further price decline.
Recap
In the middle of last month, we looked at a potential short setup as GC was showing signs of being overbought. It was also trading at the top of an upward-sloping channel which signaled to us that the top may be in for the time being. (Read more)
Technical analysis
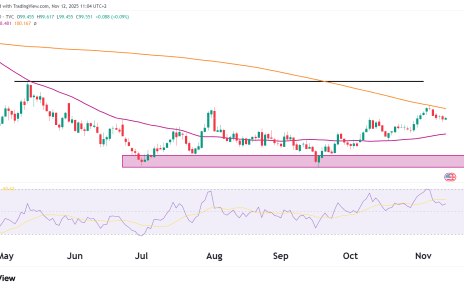
There are a few technicals we can look at on the chart that are pointing toward a potential bullish reversal. The first being is the 100-day moving average which is at a price of $1,949.
Minor support at $1,959.8 has been formed from the previous high back on February 2nd and could also hold prices from falling further.
Volume profile shows us the point of the control line is at $2,000. A small bounce from here would lead to the first target being this POC line.

Trade Ideas
The chart appears to have a greater expectancy for long trades at the moment. Stop can be placed below the recent lows at $1,936, and targets can start at the POC mentioned above and then at the recent highs at $2,057.