


Light Crude Oil Futures have been showcasing resilience, marking an upward trajectory after a consolidation phase at a key support level. The weekly chart reveals a rally above the 40-week moving average. The price is trading within the Bollinger Bands, edging closer to the upper band.

The RSI on both daily and weekly charts is hovering near the 60 mark, which points toward buying interest without the indicator moving into overbought territory. The recent close above the $80 mark is a technical confirmation of bullish control.
Weekly Chart Notes:
- The price is maintaining above a critical support level, suggesting the market is respecting this zone.
- The Moving Average alignment indicates a bullish trend with the price above both the short-term and long-term MAs.
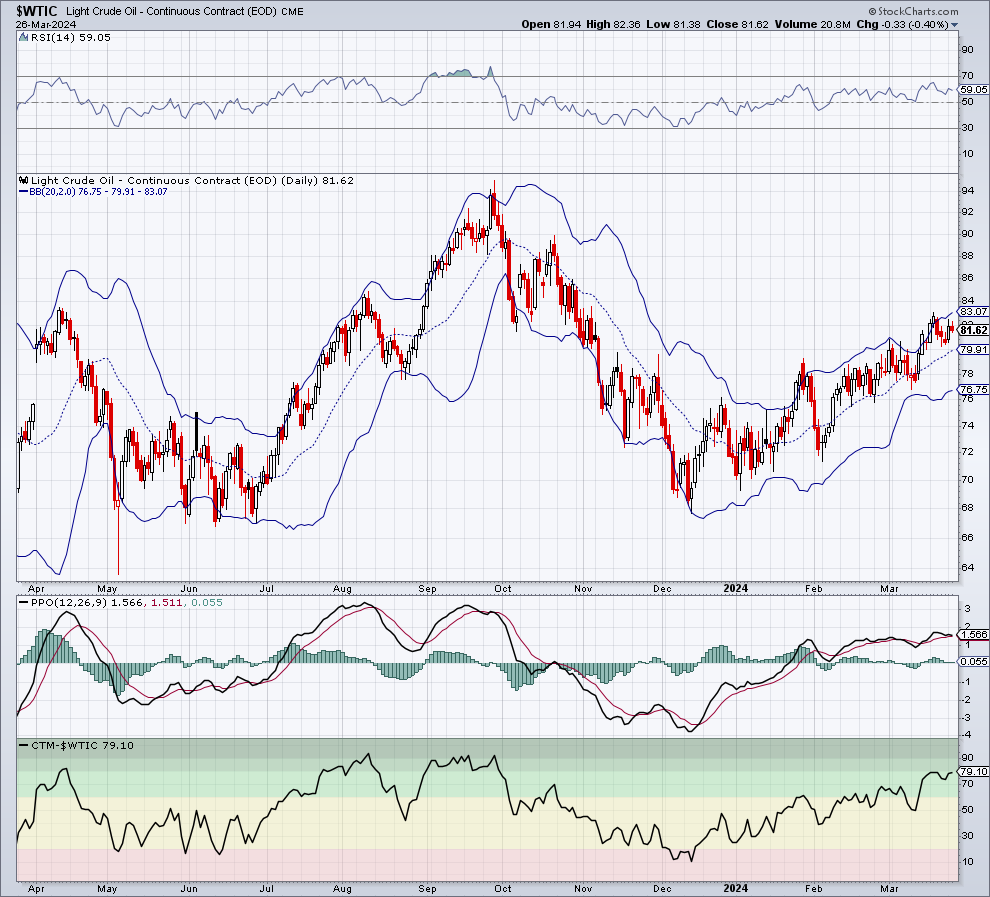
Daily Chart Notes:
- The Bollinger Bands are widening, suggesting increased market volatility with potential for upward price movement.
- The RSI is neutral, not signaling overbought or oversold conditions, allowing room for price movement in either direction.
Trade Opportunities:
- Long Position: If the price sustains above the support level, initiating a long position with a target at the recent high around $85 could be considered. This aligns with the bullish momentum observed on the weekly chart. A stop-loss can be placed below the support level to manage risk.

