- Key support broken last week, daily chart shows rounding top formation.
- Bullish medium-long term outlook, but watching near-term levels.
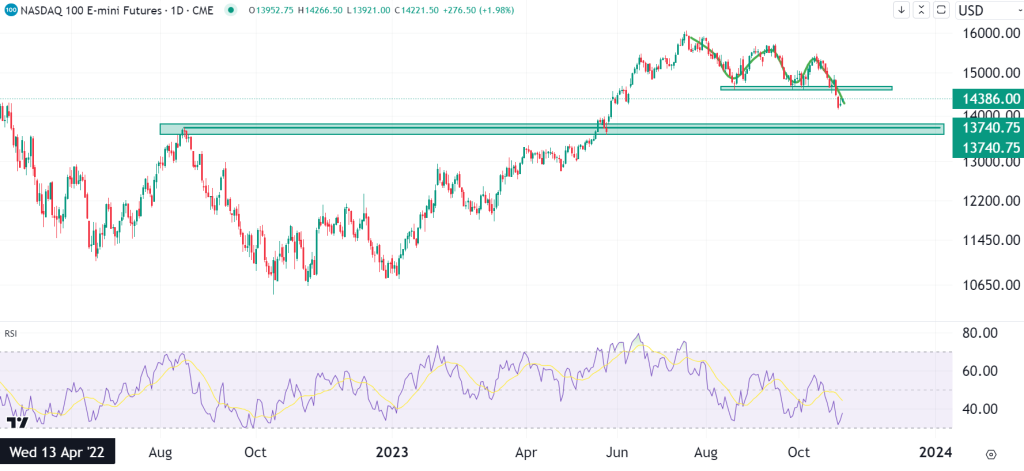
- $14,700 initial resistance, $13,740.75 major support if downtrend continues.
The market plunged last week, taking out key support levels as the daily chart resembles a rounding top formation. From here, the market still looks bullish in the medium to long term, but let’s take a look at the technicals and levels to watch for this week.
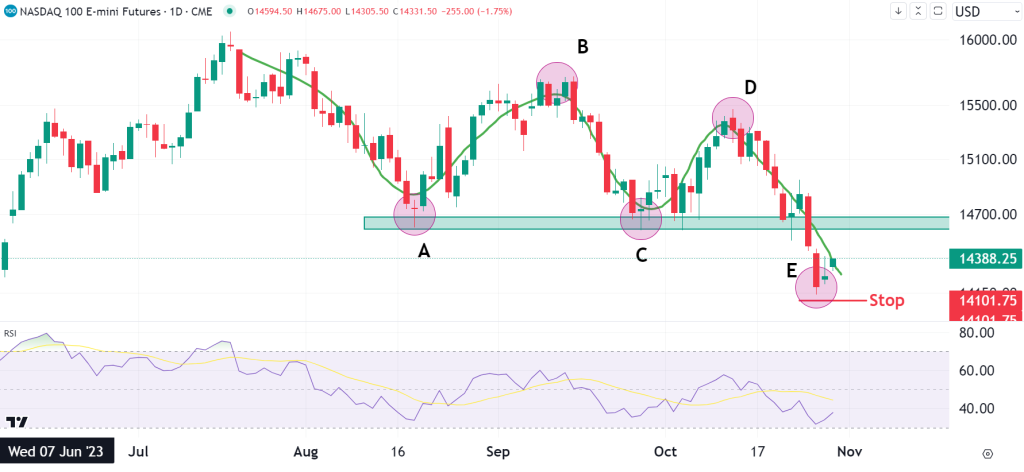
You can see the $14,700 level, which was broken last week by the green box on the chart below. This is the first level to watch for at the moment. If we see some bullish price action, then that would be the first level we could assume some selling pressure to enter the market. Also, we can take note of the potential morning start candlestick formation from Friday’s close. If today ends green, then we have a confirmation and a possible placement for the stop loss below that candle (Also shown on the chart below).
The recent retracement from the highs made back in July has resembled that of an Elliott wave theory retracement wave. At the moment, the price is currently at point E, which is one retracement too long for an official corrective way, which could lead to a further decline and the continuation of a downtrend instead of just a correction.
A key level to note if prices fall further is the support at $13,740.75. That is the most relative support if prices fall, but it is more likely we will see a up move in price from here, at least for the next week or so, before that becomes a possibility.