Introduction
We know that when uncertainty exists in the marketplace, and people want to protect their money, bond yields will go down. In this technical article, we will focus on ZB and how we can profit from potential market moves by looking for high probability and high risk-reward ratio trades.
Technical analysis
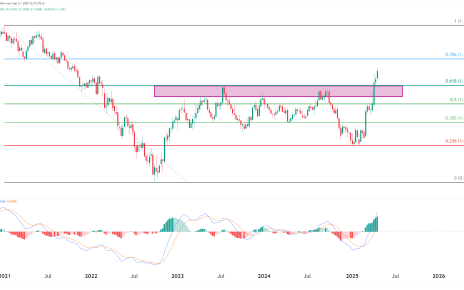
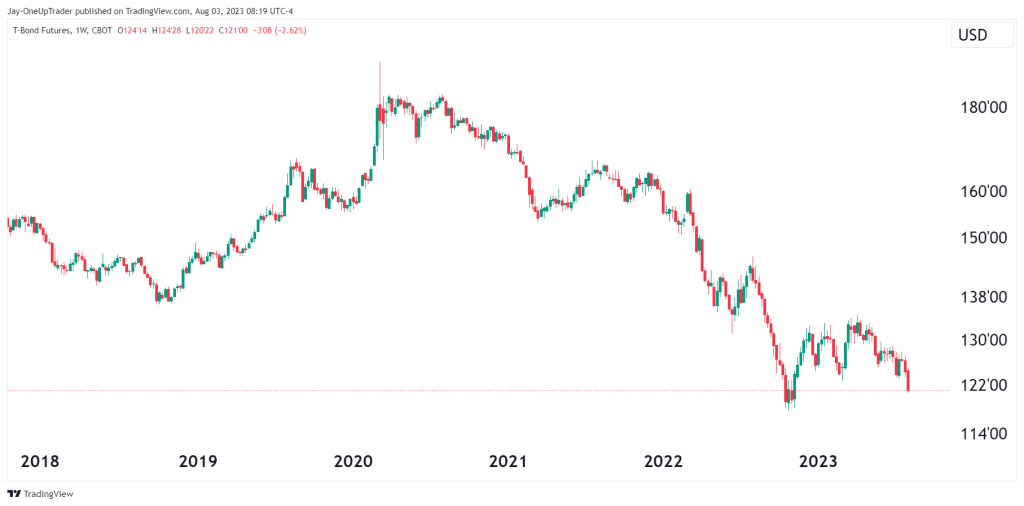
The weekly chart continues with a downward trend showing us how much bond buying is going on. I haven’t put any indicators on the chart, so we can keep it as simple as possible. It is a far better idea for traders to not fight the trend, so any who wish to long this market should do so with caution and strict risk management rules in place.
The weekly chart also resembles a rolling over of price action, and it could accelerate to the downside in the coming weeks.
Daily Chart
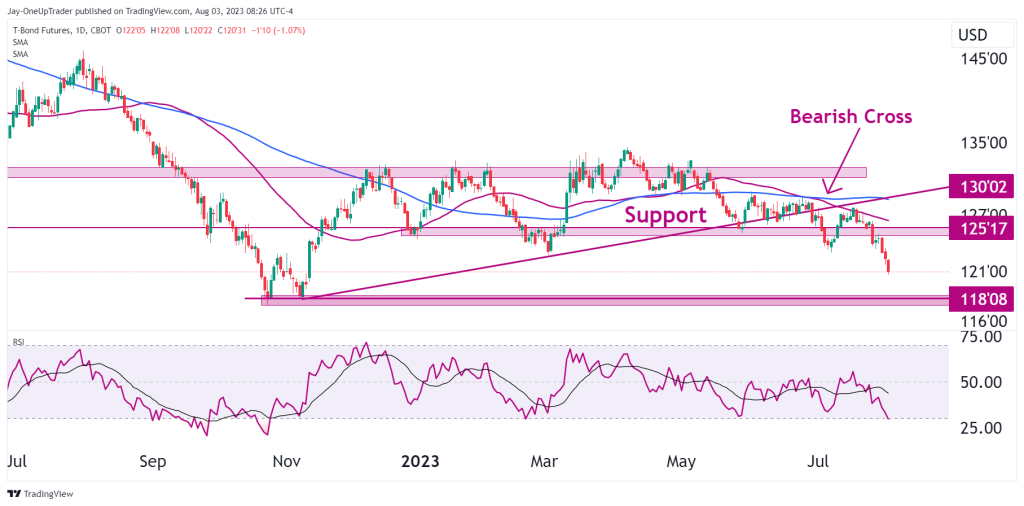
The daily chart is also bearish in most of its formations and indicators. The price action shows a lot of downward momentum, but we should still look for ways to enter on pullbacks instead of chasing the market lower.
The most immediate target is 118’08, which is the yearly low.
The RSI is just approaching oversold, but this is a good sign because we are just at the beginning of a breakout.
The 50 MA is below the 100 MA, too, and crossed recently.
Trade Ideas
The support level at 125’17 would be ideal for traders who want to short. There could be potential buying opportunities at the support at 118’08, but we would need to see a lot of demand and strong green candles to give us an entry.