- Inverse head and shoulders still playing out on the daily chart.
- MACD cross shows bulls are in control.
Zoomed out daily chart outlook
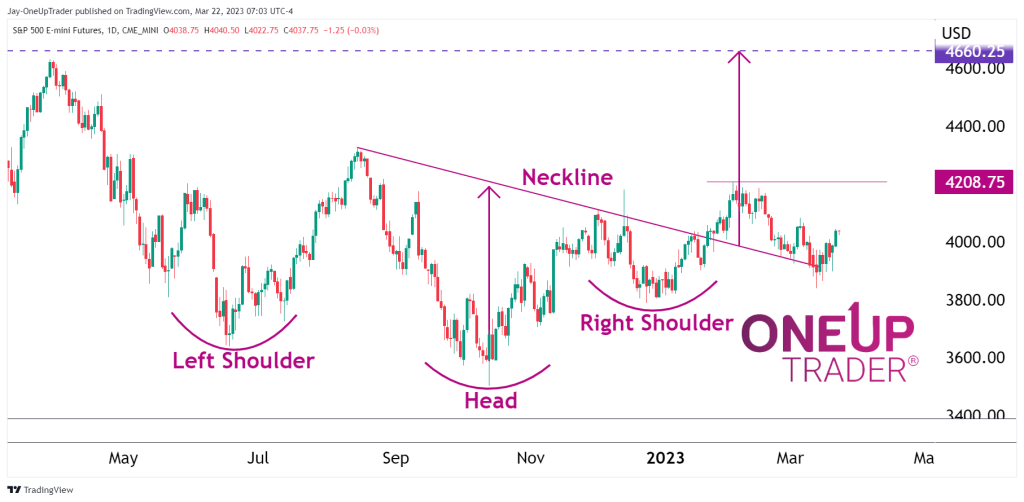
It has been a while since we looked at the S&P 500. The inverse head and shoulder we have been monitoring is still playing itself out slowly as price continues to sit on the neckline. Finally, we see price is pushing above the neckline.
The swing high at $4,208.75 would confirm what we could call the start of the next bull market. As we see, price has consolidated sideways for almost a year after a 30% retracement from the highs in 2022. This is a bullish sign, and traders should strongly consider if they wish to short against the long-term trend.
Clearing $4,208.75 means the next target for bulls is $4,660.25, which is the 2022 high.
Zoomed in
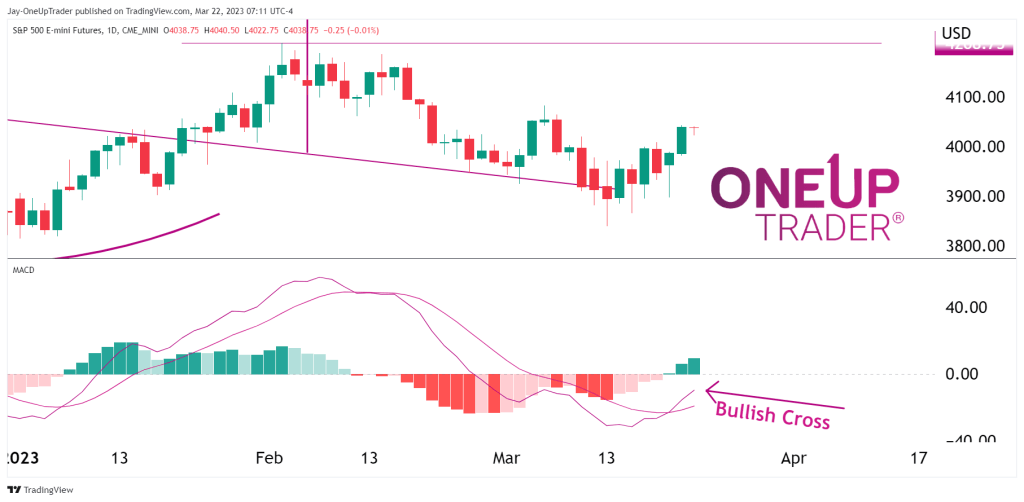
The macd is showing a strong bullish formation as the macd line has crossed above the signal line below the 50 level. The histogram has also just printed its first two green bars showing bulls are in control.