


Introduction
Crude oil prices have broken decisively below a year-long multi-test support zone (~$66–68), a structural breakdown as US markets continue to plunge. With prices now trading near the $58 mark, the previous support would now be resistance but time will tell if the price will go back up to test that level.
This level has held since the start of 2023. However, the current selloff is the most aggressive weekly breakdown since then. From a macro perspective, the move is being accelerated by:
- Mounting U.S. recession fears
- Crashing demand expectations
- Broad-based risk aversion as seen in equity markets
- A persistently strong supply outlook, particularly from non-OPEC producers
Weekly Chart Analysis
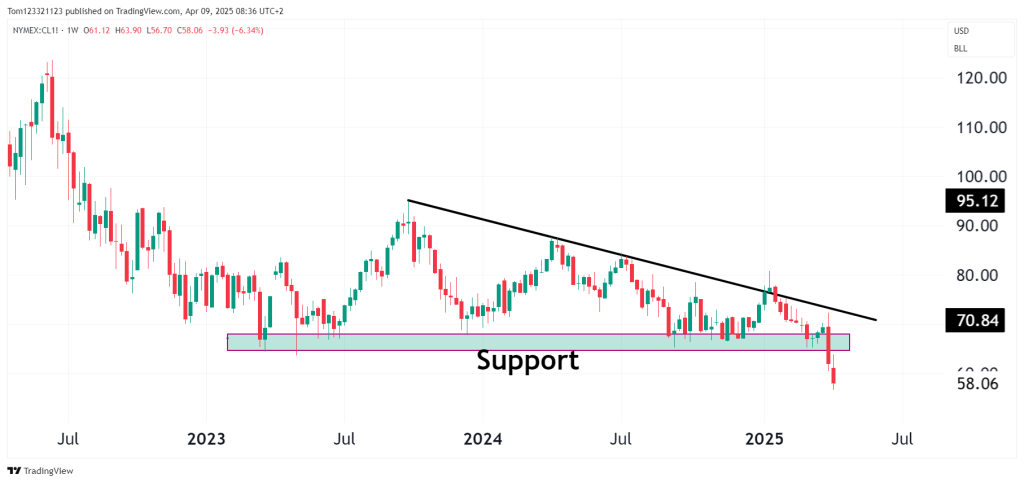
- Price has clearly broken down from a descending triangle pattern.
- The descending resistance trendline from 2022 highs continues to define lower peaks.
- The $66–68 support held on 4 occasions since late 2022 — but this latest break on strong red candles has turned that level into resistance now.
Bearish Breakdown Highlights:
- Weekly candle down ~6.3%.
- No major support visible until $50–52, a zone from mid-2021.
Daily Chart Analysis

- Price sliced through the support zone without hesitation and has continued to fall for 6 consecutive sessions.
- Both the 50-day and 200-day moving averages were rejected in late March.
- RSI is deeply oversold at 24.04, so there could be a bounce — but strong bear trends can remain oversold for extended periods.
Candle Structure:
- Each candle is opening at or near the previous day’s close so there is no real buying pressure or bounce interest.
- The free-fall price action is more typical of markets pricing in a demand shock or large macro repricing.
Macro Context: What’s Driving the Fall?
Supply Not Backing Off
- U.S. shale production remains resilient near multi-year highs.
- No indication from OPEC+ of an imminent coordinated production cut, despite price declines.
Stronger Dollar in Relative Terms
- While the USD has recently been weak, risk-off flows may return to the dollar as a safe haven.
- A rising dollar generally places downward pressure on commodities, particularly oil priced in USD.
Trade Opportunities
Bearish Continuation Trade (Medium-Term)
- Entry: On retest of $62–63 area (previous support = new resistance)
- Stop: Above $66
- Target 1: $54
- Target 2: $50
- Conviction: High — confirmed breakdown on both timeframes with macro alignment
Rebound Play (Short-Term Mean Reversion)
- Setup: Buy if price bounces off $56–57 intraday with reversal candle
- Stop: Below $55
- Target: $62–63
- Conviction: Moderate — pure technical oversold bounce
⚠️ Only suitable for aggressive short-term traders — macro and trend remain bearish.
Summary Table
| Factor | Signal |
|---|---|
| Weekly Structure | Bearish Breakdown |
| Daily Momentum | Strongly Bearish |
| RSI | Oversold Daily |
| Macro Demand Outlook | Weakening |
| Oil Supply Dynamics | Stable to Rising |
| Overall Bias | Bearish |
Final Thoughts
Crude oil is now in bear market territory, and without significant OPEC+ intervention or a surprise improvement in global macro conditions, price action favors continued downside. While an oversold bounce may materialize, rallies should be viewed as opportunities to sell until the technical structure repairs and demand expectations improve.
Key Level to Watch: $66–68 — now resistance, critical for any shift back to neutral. Until then, the bears are firmly in control.

