


Introduction
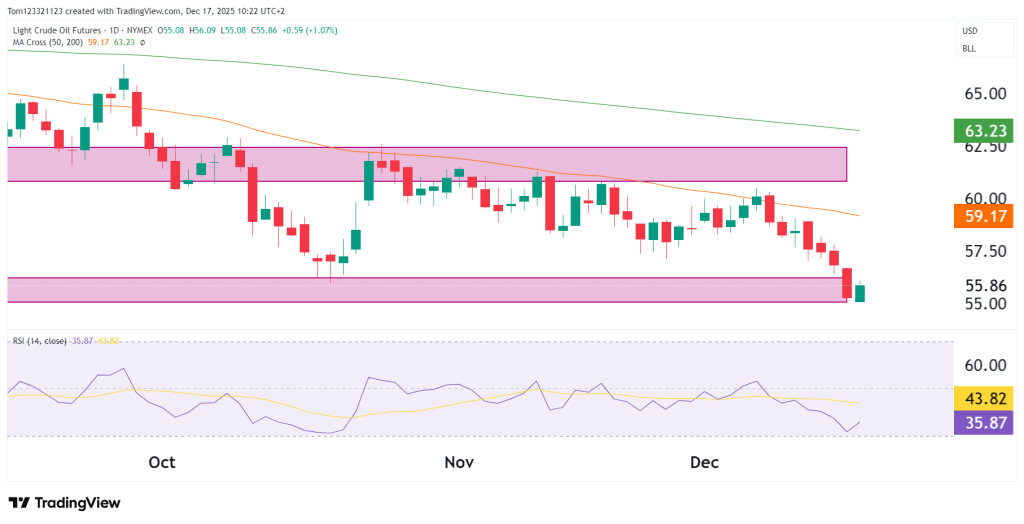
In our previous analysis, CL was trading just below the 200-day moving average after testing it as resistance. Price has since dropped from there by 8% to test the support zone at $55.8, and bulls will be trying to hold that level, as there are no horizontal support levels below that, which means we could see CL drop with high volatility.
Let’s take a closer look at the technicals and what we can learn from them.
Technical Overview
Continuing from our introduction, crude oil continues to be on the side of weakness as price continues to maintain a bearish tone. The bears have not fully taken control because the price is still holding above the support level marked on the chart below. Overall, the price has been bearish as the year started with price at $71 and now trading at $55.8.

Momentum indicators continue to reflect weakness. The RSI remains below the 50 level and recently got very close to oversold territory, suggesting downside momentum is still present, although short-term stabilisation may emerge near current levels.
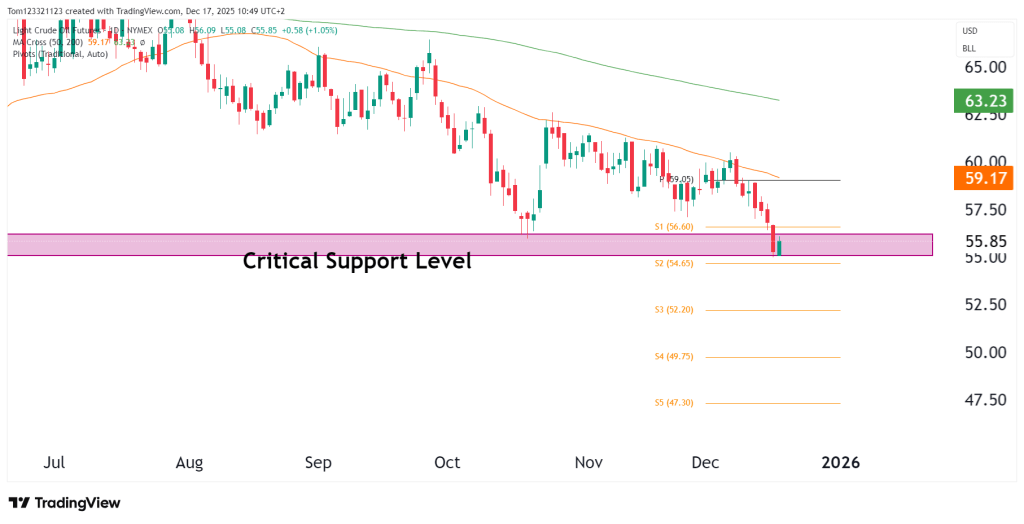
If sellers are able to push the price below the current support level, then the pivot point indicator is a good gauge of targets in the short term, as seen in the chart below.
Key Levels to Monitor
- Resistance: 58.80 – 60.00 (former range support and declining 50-day MA)
- Near-term Support: 55.00 – 55.50 (range lows and demand zone)
- Lower Support: 52.50 – 53.00 (measured move / structural support)
A sustained move back above the $60 handle would be required to neutralise the current bearish structure, while acceptance below the $55 area would expose the market to deeper downside risk.
Fundamentals
From a fundamental perspective, crude oil remains sensitive to supply-side developments and near-term macro data. Markets continue to weigh OPEC+ production discipline against concerns over slowing global demand, particularly from China and Europe. U.S. production remains elevated, keeping supply risks skewed to the downside unless export demand improves.
In the near term, traders will be watching weekly EIA crude oil inventory data, which can drive short-term volatility, along with any OPEC+ headlines around compliance or potential policy adjustments. Broader macro events — including U.S. inflation data, Federal Reserve policy signals, and movements in the U.S. dollar — may also influence oil prices indirectly through risk sentiment.
Outlook and Estimated Probabilities
Given the prevailing trend structure and momentum conditions, the path of least resistance remains to the downside unless price can reclaim key resistance.
| Scenario | Estimated Probability | Notes |
|---|---|---|
| Continued consolidation between 55–59 | N/A | Most likely outcome as price digests recent losses near support. |
| Breakdown below 55 toward lower support | N/A | Would confirm renewed downside continuation within the broader downtrend. |
| Recovery back above 60 resistance | N/A | Would require a strong momentum shift and acceptance above the 50-day MA. |
Summary
Overall, crude oil remains technically vulnerable, with rallies likely to be viewed as corrective until proven otherwise by a sustained shift in structure and momentum.
This analysis is for educational and informational purposes only and does not constitute trading advice or a recommendation to buy or sell any futures contracts. Futures trading involves significant risk and may not be suitable for all investors. Always conduct your own research and consult with a licensed financial professional before making trading decisions.
