


Introduction
Crude Oil futures have rebounded from the $55 support zone and are now pushing into the mid-$60s. The move higher marks a clear shift in the short-term trend, but the bigger picture remains more complex as CL has struggled to find clear bullish power.
The range-bound price action in the longer term has meant that CL has no meaningful direction yet. The short-term rally that we have seen also has not been with a clear conviction, which leads us to believe it is a short-term bounce, and a test of the support zone below is possible in the future.
Let’s take a closer look at the technicals and what they are telling us.

Market Summary
Primary trend: Neutral to corrective on higher timeframes
Current market perspective: Base-building recovery attempt
Key support: $55–56
Bias-defining level: $66–68
Risk: Rejection below $62 and failure back under $59
Fundamentals Driving Oil Right Now
1. OPEC+ Production
OPEC+ officials have recently repeated that they’re sticking with their current production quotas. That’s helped calm the market and support oil prices. Right now, traders are reacting quickly to any news about possible production changes, so headlines still matter a lot.
2. U.S. Strategic Petroleum Reserve (SPR)
There’s ongoing talk that the U.S. government may refill the Strategic Petroleum Reserve if prices fall into the mid-$60 range. That creates a sense that there’s steady demand under the market. Many traders now see the $55–60 area as a strong support zone partly because of this potential government buying.
3. EIA Inventory Trends
Recent weekly reports from the EIA show a few important shifts:
- Crude inventories aren’t rising as quickly as before
- There have even been small drops in total crude stockpiles some weeks
- Gasoline demand has been steady to slightly higher
- Refineries are running at slightly higher capacity
Earlier in the price decline, large and steady inventory builds added pressure and pushed prices lower. Now that inventory growth is slowing, that downward pressure is easing.
Stocks aren’t falling sharply, but they also aren’t piling up the way they were. That takes away some of the momentum that was driving prices down.
If we start seeing consistent inventory draws in the coming weeks, that would be a strong sign that the market is tightening and could support higher prices.
4. Commitment of Traders (COT) Positioning
Recent CFTC data shows that:
- Hedge funds and other large traders have reduced their bullish bets
- Positioning is no longer crowded on the long side
- Commercial hedgers have cut back on their short positions
When oil was trading above $75, a lot of traders were heavily positioned for higher prices. That made the market fragile. Once prices started falling, many of those bullish positions were closed out, which added to the drop.
Now that much of that excess speculation has been cleared out, the market is in a healthier and more balanced position.
Market Structure & Trend
Weekly Chart
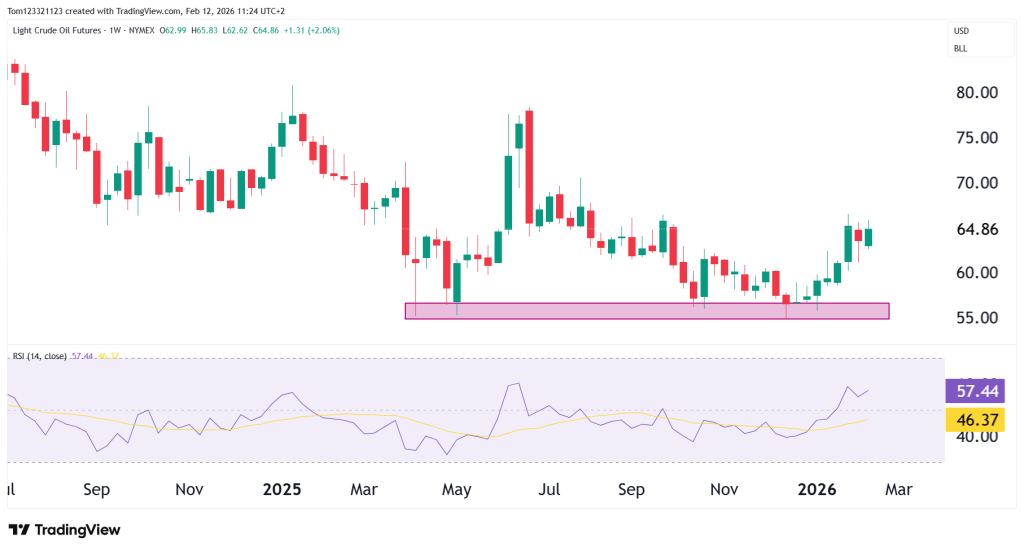
The weekly chart shows the overall downtrend and consolidation. The $55 level is very important for the bulls, if price does not hold there, there is a high chance of a volatile drop below that.
If price moves above $65, the bullish case strengthens.
Daily Chart
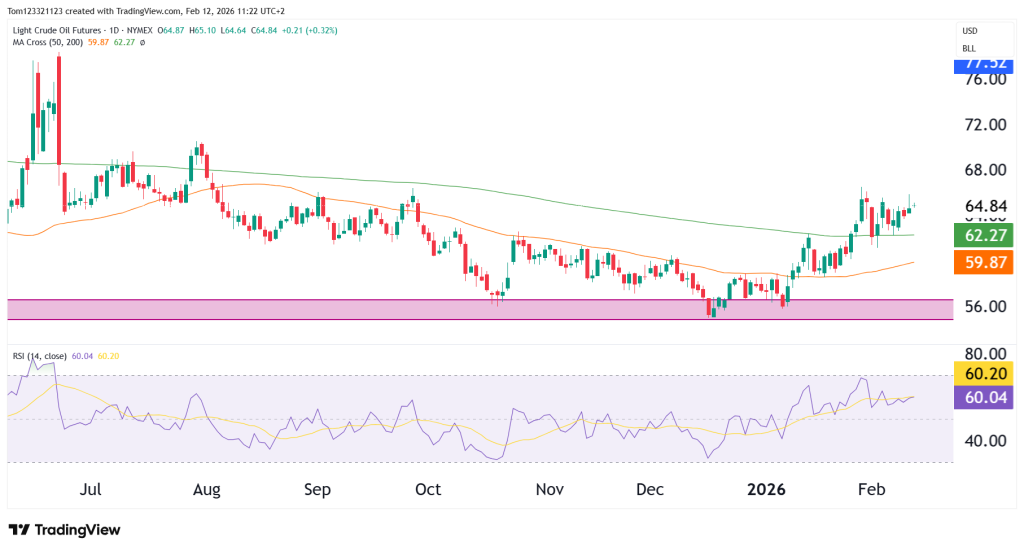
On the daily timeframe:
- Price is above both the 50-day and 200-day moving averages
- The 50-day MA is curling higher
- RSI near 60 confirms improving momentum without overextension
There is some resistance around these levels and wicks on the upside. A strong push from the bulls can get the price higher and continue the move, but some weakness here brings back the 200 MA into focus.
Looking Forward: Scenarios
Bullish Breakout (40%)
Acceptance above $68 leads toward $72+.
Range Expansion (35%)
Crude oscillates between $60 and $68 while building a longer-term base.
Failed Recovery (25%)
Rejection sends price back toward $56 support.
This analysis is for educational and informational purposes only and does not constitute trading advice or a recommendation to buy or sell any futures contracts. Futures trading involves significant risk and may not be suitable for all investors. Always conduct your own research and consult with a licensed financial professional before making trading decisions.
