Introduction
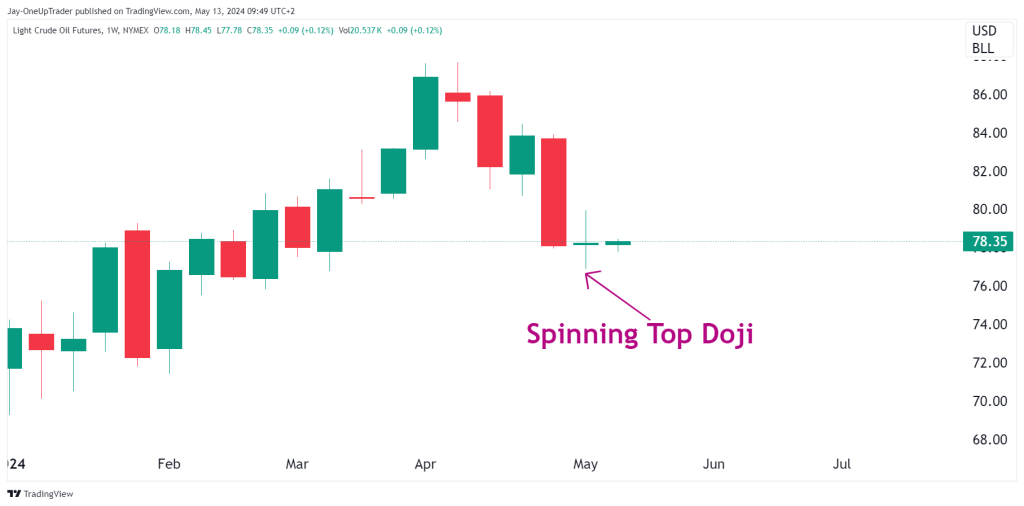
CL ended last week with a spinning top formation on the weekly chart after a fairly small range of trading. Volume was also slightly below the weekly average telling us that there was indecision in the market and a potential move coming up that we can capitalize on. The week prior we saw CL plunge 6.8%, this lead to the spinning top doji last week, and now we must try to find what the probabilities are telling us and if they point toward a green or red week.
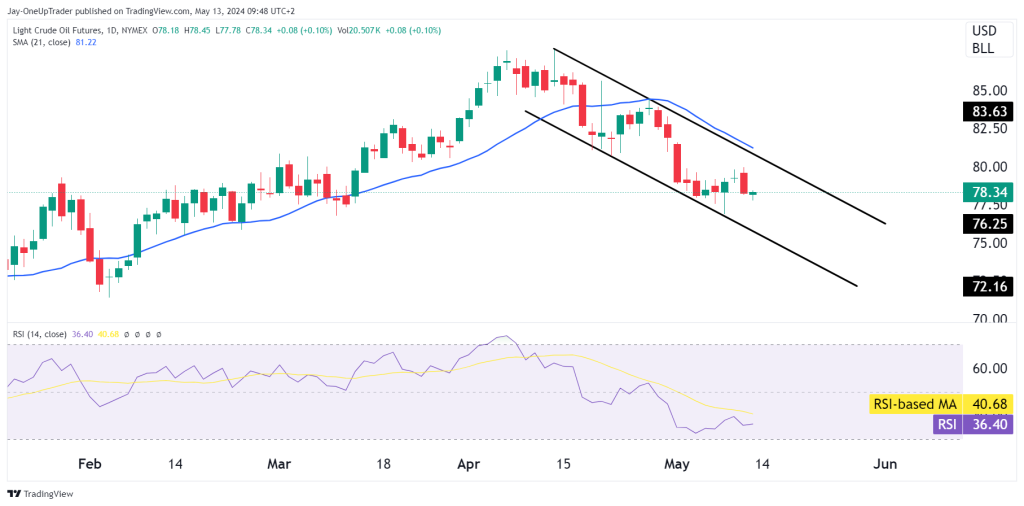
Daily Chart
At the moment, CL is trading below the 21 moving average, which is our short-term gage on momentum. If the price is below the MA, we like to look only for shorts and vice versa unless there is an extreme in the market where we see it very overbought or oversold.
The RSI has also been trending down but is not near the oversold level, so we can really use this indicator right now. If we see the RSI reach oversold, it would be time to stop taking shorts.
A small trend channel has formed on the daily basis, which started at the start of April. It resembles a small bull flag, but the issue is that the prior move does not resemble a flag. If we see a break above this channel, it would likely mean we see a break above the 21 MA. This is when we can look for longs.
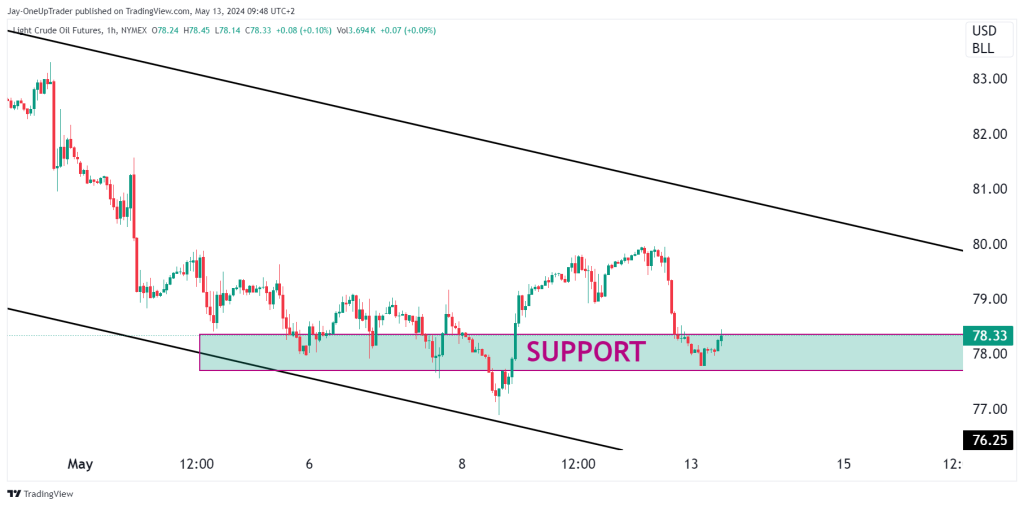
Hourly Chart
Looking at the hourly, there is a support zone at $78, which we can monitor for short-term action. Traders looking for quick flips could buy in this zone, targeting $79.50.
Bulls want to see this support hold, if it doesn’t, the trend remains bearish in the medium term.