Introduction Nasdaq-100 futures (NQ) are stabilizing after bouncing from a multi-week low near 24,300 earlier in November. The index has now reclaimed the 25,000 level and is trading just beneath a major resistance band that has capped every rally since late October. From here, bears could try to push the price back to the level Read More…
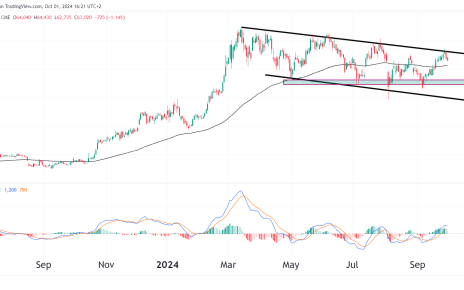
Introduction Bitcoin is up 43% YTD and 131% for the past year. The surge has come after a horrific bear market that saw ‘digital gold’ crash by 80%. The rally we have seen has now stalled, and the chart is no longer printing aggressive higher highs like we saw earlier in the year. However, it Read More…
Introduction The S&P 500 E-mini Futures (ES) is hovering just below its all-time high (ATH) near 6,900. The market remains steady following last week’s rally driven by improved risk sentiment and softer U.S. economic data, which helped reinforce expectations that the Federal Reserve will maintain its policy pause. Equities are consolidating at all-time highs so Read More…


