

Introduction
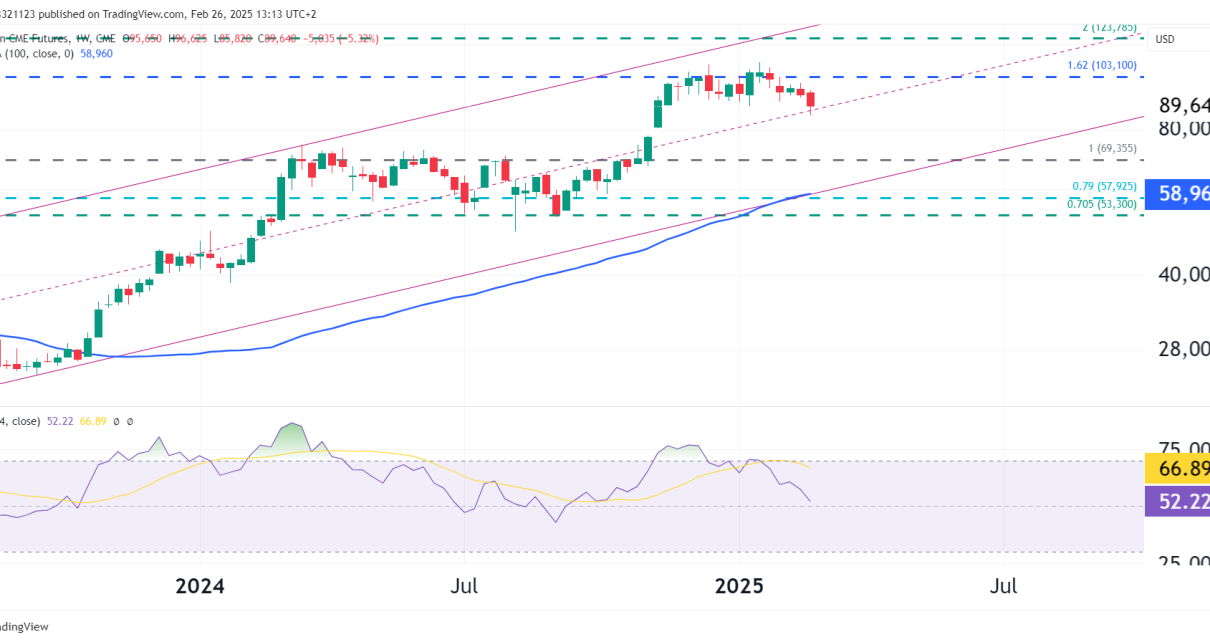
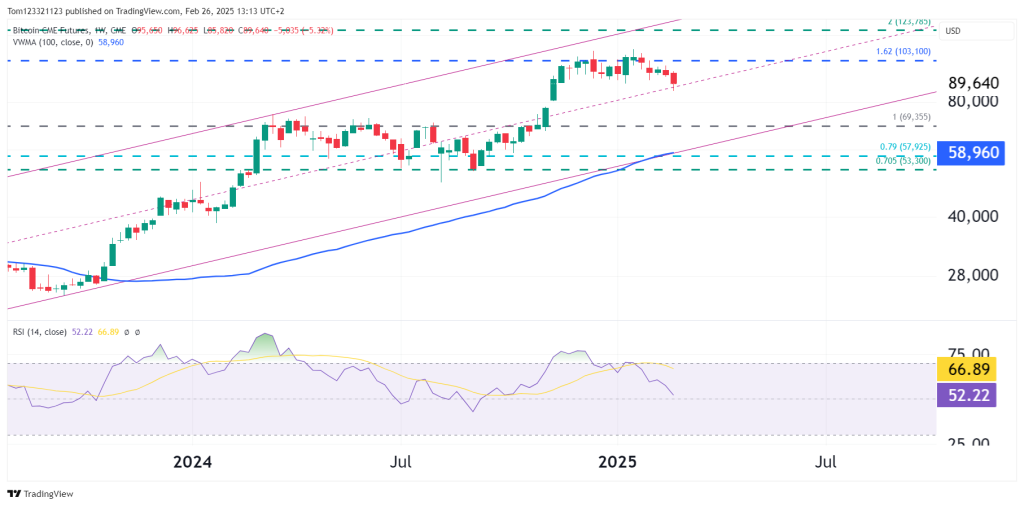
Bitcoin CME futures (BTC1!) have pulled back after reaching recent highs, with price now testing mid-channel support. The broader trend remains bullish, but momentum is slowing as profit-taking and resistance near key Fibonacci levels weigh on price action.
As of today, Bitcoin is trading at 89,640, down -5.32% on the week and 22% from its all time high, marking one of its sharpest weekly declines in months. While the long-term trend remains intact, the market is at a point where bulls need to defend support in order for the trend to remain bullish.
Market Drivers & Key News Events
- ETF-Driven Rally Cooling Off: Bitcoin’s rally has been fueled by institutional adoption, particularly the approval and launch of spot Bitcoin ETFs in the U.S.. However, after an initial surge in inflows, some cooling-off has occurred, leading to price consolidation.
- Pre-Halving Volatility: Bitcoin’s halving event is approaching (expected in April 2025), historically a bullish catalyst. However, pre-halving price action often sees corrections and volatility before the next major move.
- Macro & Fed Policy Impact: Bitcoin remains sensitive to interest rate expectations. While markets are still pricing in rate cuts later in 2025, recent inflation data has introduced uncertainty, leading to broader risk-off sentiment across markets.
- On-Chain & Market Sentiment: Recent on-chain data suggests long-term holders are taking profits, while exchange reserves have increased, signaling short-term selling pressure.
Technical Outlook
Trend Still Bullish, But Watch for a Deeper Pullback
- Bitcoin remains inside an ascending channel, with the mid-channel trendline currently being tested.
- The 100-week VWMA (58,960) remains far below price, confirming that the long-term trend is intact despite short-term volatility.
- Fibonacci extension levels at 1.0 (69,355) and 1.62 (103,100) are key pivot zones.
- The RSI is cooling off from overbought territory (currently 66.89) but remains in a bullish range, supporting continued upside if buyers step in soon.
Key Support & Resistance Levels
- Resistance Levels:
- 95,000 (Short-term resistance & psychological level)
- 103,100 (1.62 Fibonacci Extension – Major Upside Target)
- Support Levels:
- 85,000 (Mid-Channel Support – Key Zone for Bulls to Hold)
- 69,355 (1.0 Fibonacci – Major Support If Correction Deepens)
- 58,960 (100-week VWMA – Long-Term Bullish Structure Level)
If Bitcoin holds 85,000, the uptrend remains intact, and another push toward 95,000 – 103,100 could follow. However, a break below 85,000 increases the risk of a larger correction toward 69,355 or even the 100-week VWMA.
Momentum & Market Sentiment
- 100-Week VWMA Holding Well Below Price: No signs of major structural weakness in the long-term trend.
- RSI Cooling Off: Bullish momentum is fading slightly but has not flipped bearish.
- Profit-Taking Visible: Increased exchange inflows suggest short-term selling pressure.
The overall sentiment remains cautiously bullish, but a short-term pullback is developing.
Bull & Bear Scenarios
Bull Case: Holding 85,000 & Break Above 95,000
- If Bitcoin stays above 85,000, consolidation could set up a move toward 95,000 and 103,100.
- The pre-halving narrative remains intact, which historically favors further upside.
Bear Case: Breakdown Below 85,000
- If price falls below 85,000, a retracement toward 69,355 is likely.
- A break below the 100-week VWMA (58,960) would signal a deeper trend shift.
Final Outlook
- Short-Term (1-2 Weeks): Neutral to bearish, watching 85,000 support.
- Medium-Term (1-3 Months): Bullish above 85,000, targeting 95,000 – 103,100.
- Long-Term (6+ Months): Still bullish unless Bitcoin falls below 58,960.


