

Introduction
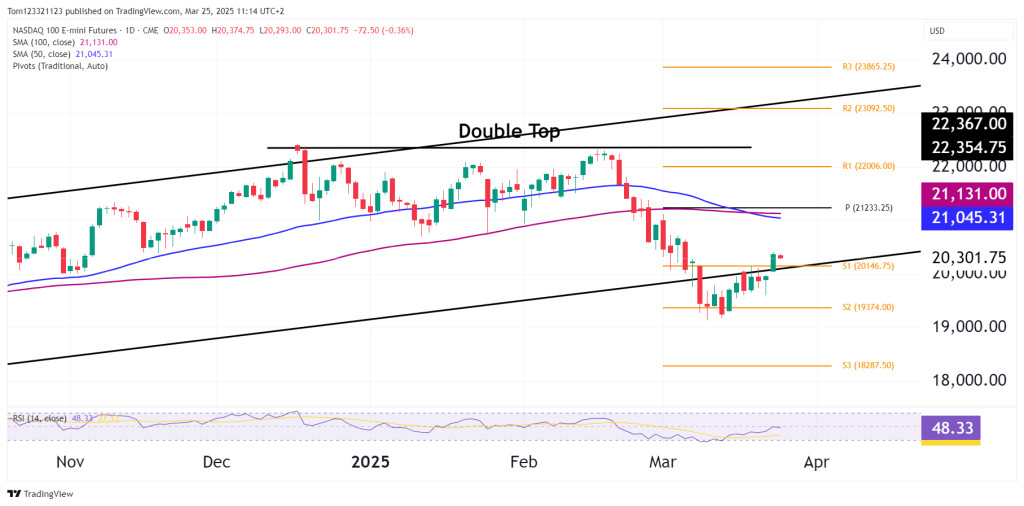
The NASDAQ 100 (NQ) has staged a strong short-term recovery from the 19,000 support zone, pushing back above the lower trendline of the long-term rising channel. This move follows a steep correction off the double top formation near 22,000.
Technical Breakdown
Chart Structure
- Double Top confirmed around 22,000, with neckline break triggering a drop to 19,000.
- Recent bounce retested and is hovering around the lower trendline of the ascending channel.
- A retest of the 20,300–20,400 zone is underway, which previously acted as key support and is now being tested as resistance.
Bull vs Bear Case
Bull Case:
- Price has reclaimed the lower channel line, reducing immediate downside risk.
- Strong series of higher lows and higher closes over the past week—short-term bullish structure.
- RSI bouncing from near-oversold supports continued momentum building.
- Target zone opens up toward 21,000–21,200, which aligns with the SMA confluence and pivot resistance.
Bear Case:
- Price is below both the 50 and 100-day SMAs, with a clear downtrend from the ATH double top still intact.
- Rejection from the lower trendline (now acting as resistance) could trigger a second leg lower.
- Weakening macro backdrop or failure to hold above 20,000 would invalidate current recovery structure.
Trade Opportunities (Short-Term)
Trade Idea 1 – Long Breakout Continuation
- Entry Trigger: Break and close above 20,400
- Stop Loss: Below 19,980
- Target 1: 21,130 (100-SMA resistance)
- Target 2: 21,233 (Pivot)
- Target 3: 22,006 (R1)
Risk/Reward: ~1:2 or higher on Target 2. Ideal if index sentiment stays positive post-FOMC.
Trade Idea 2 – Short Rejection Play
- Setup: Price fails to hold above channel lower boundary (~20,300–20,400 zone)
- Entry Trigger: Bearish reversal candle or daily close below 20,150
- Stop Loss: Above 20,450
- Target 1: 19,374 (S2)
- Target 2: 18,287 (S3)
Works best if equities turn risk-off and price gets rejected hard from channel resistance.
Summary
| Technical | Status |
|---|---|
| Trend | Bearish medium-term, bullish short-term |
| Structure | Bounce from trendline; double top remains a cap |
| Momentum (RSI) | Recovering, but not strongly bullish yet |
| Key Resistance | 21,000–21,200 |
| Key Support | 20,000 / 19,374 / 18,287 |
Outlook
NQ is in a recovery mode, but is not out of the woods yet. A break above 20,400 would open space toward the moving averages and pivot zone. Failure to hold above 20,000 re-exposes the index to downside momentum.
