- GC still maintaining its bullish momentum.
- Weekly and daily chart testing the 50 moving average.
- Levels to watch.
Introduction
Not much has changed since our previous analysis in GC, as sentiment remains bullish in the medium to long term. There is a small pullback at the moment, which is looking close to providing a long opportunity in the yellow metal though. With the increasing uneasiness in the Middle East, we could see gold as the next big market performer as we move into 2024.
Weekly Chart
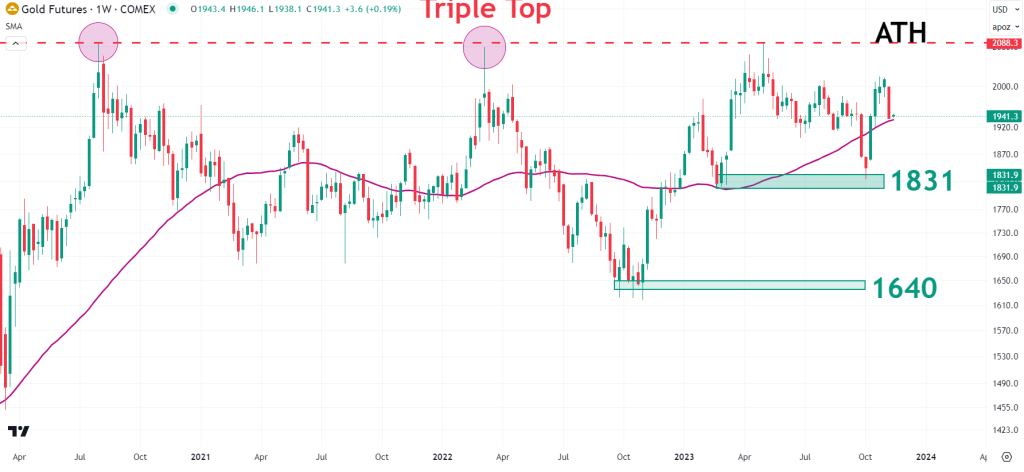
The weekly chart closed red last week, down 3.7%, and is now currently testing the 50 moving average. Bulls will be hoping it acts as support, but we can wait to see the close for this week and if we see a bullish hammer formation or a spinning top, it could be the catalyst for the next bullish move and long entry.
Daily Chart
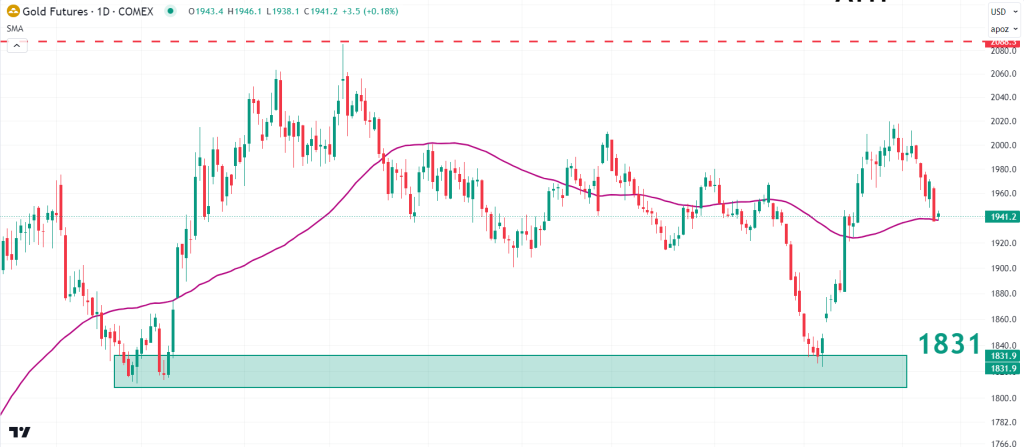
The daily chart is also testing the 50 moving average at the same time the weekly chart is. The RSI has crossed below the 50 line but is holding well so far. The recent rally in GC from the beginning of October saw a near 11% rally. Currently, the price has pulled back 38% of the move signaled by the Fib retracement in the chart below. From here, if we see today close with a very small range and possibly tomorrow too, that could be exactly what bulls are looking for to take a long position.
Levels To Watch
Obviously, the $1831 level is extremely crucial as a major support zone. If there is any chance that GC falls down from here, bulls really will need to see that level hold for the sentiment to remain firmly in their favor. $1930 is a minor support zone and is the nearest to the current price of Gold. If price clears above $2020 then we could see all-time highs shorter thereafter as there is no resistance zone between the two levels.