The futures market offers opportunities either through trading or analysis. We can find interesting insights from the futures markets which help us understand market sentiment.
The COT Report
This article will discuss a report referred to as the Commitment of Traders, a weekly market sentiment publication by the Commodity Futures Trading Commission.
Market sentiment is an extremely important part of trading. It allows us to understand the positioning of the players who potentially could move the markets. Knowing that the majority of hedge funds are bullish on an asset gives us more confidence to invest in it. Similarly, knowing that almost all of the hedge funds are bullish on an asset could give us a signal that the market may be overly bullish and that it is wiser to wait before investing or even be brave enough to initiate a contrarian position in case the fundamentals start to justify it.
The CFTC publishes statistics of the futures market on a weekly basis called the Commitment of Traders — COT. The report has much valuable information inside, namely the number of futures contracts held by market participants (hedge funds, banks, producers of commodities, speculators, etc.). Two main categories have to be distinguished before going further:
- Big speculators (Leveraged funds or non-commercial players): They deal in the futures market for speculative reasons, i.e. to profit from their positions. Examples of speculators are hedge funds.
- Big hedgers (Dealers or commercial players): They deal in the futures markets for hedging purposes, i.e. to cover their operations or other trading positions. Examples of hedgers include investment banks and big industrial and agricultural giants.
The reason we have used the word big here is that we are interested in those who can make a sizeable impact on prices if they choose to initiate buying and selling activities, i.e. the big whales. Big can also mean that they invest significantly in research and in understanding the product and therefore they tend to be on the correct side of the market (or the opposite when dealing with hedgers).
Every COT report contains information on many assets, and this information comes in the form of long/short for both participants (speculators and hedgers), therefore, we have 4 sets of data for each asset and to simplify this, we can net the longs with the shorts and get a net value, that is, net speculative positions vs net hedging positions.

Obviously, the net speculative positions will have a positive correlation with the underlying asset while the net hedgers’ positions will have a negative correlation with the underlying asset:
- Example 1: Speculative net positions on the EURUSD will have a positive correlation with the currency pair because as the number of long speculators increases, the demand for the asset increases.
- Example 2: Hedgers’ net positions on Gold will have a negative correlation with the asset.
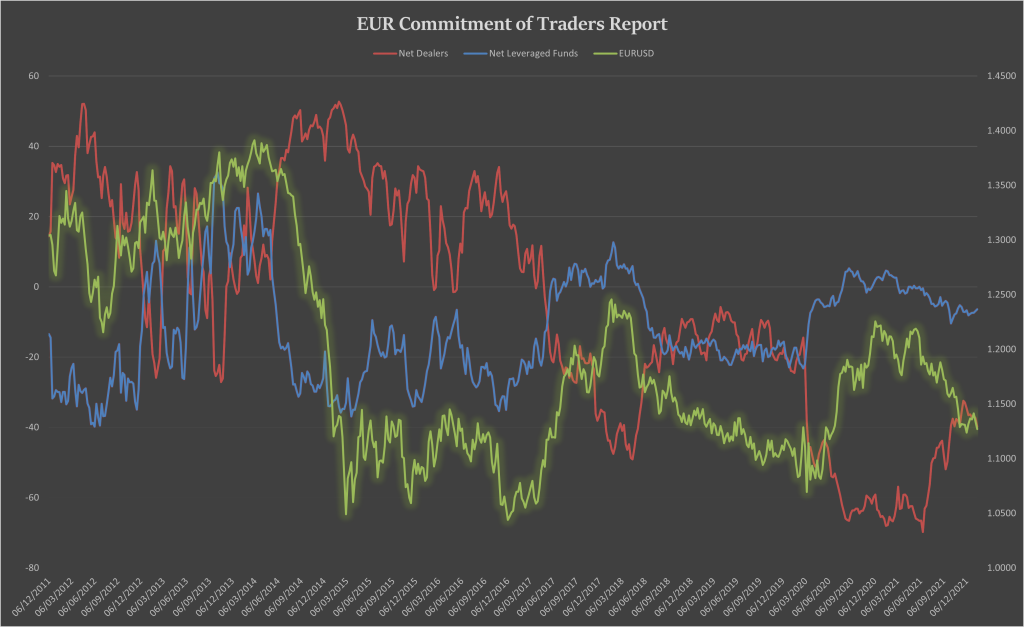
Notice in the graph above how the EURUSD (Green) is positively correlated with the leveraged funds’ positioning (Blue) and negatively correlated with the dealers’ positioning (Red). We can form many statistical and technical strategies on the COT report to help us with the long-term forecasts of the assets. This forms a huge part of the market sentiment and timing framework.
The COT report can be considered to be a leading indicator even though it is mostly a coincidental indicator but it is definitely not a lagging report. Traders generally apply volatility bands or graphical analysis on the COT values so that they have a long-term directional view of the underlying asset and then they either trade it in spot or in the futures market.
Getting the COT Data
To download the COT data, we need to head to the CFTC’s website section where the historical data of the COT report is stored: https://www.cftc.gov/MarketReports/CommitmentsofTraders/HistoricalCompressed/index.htm
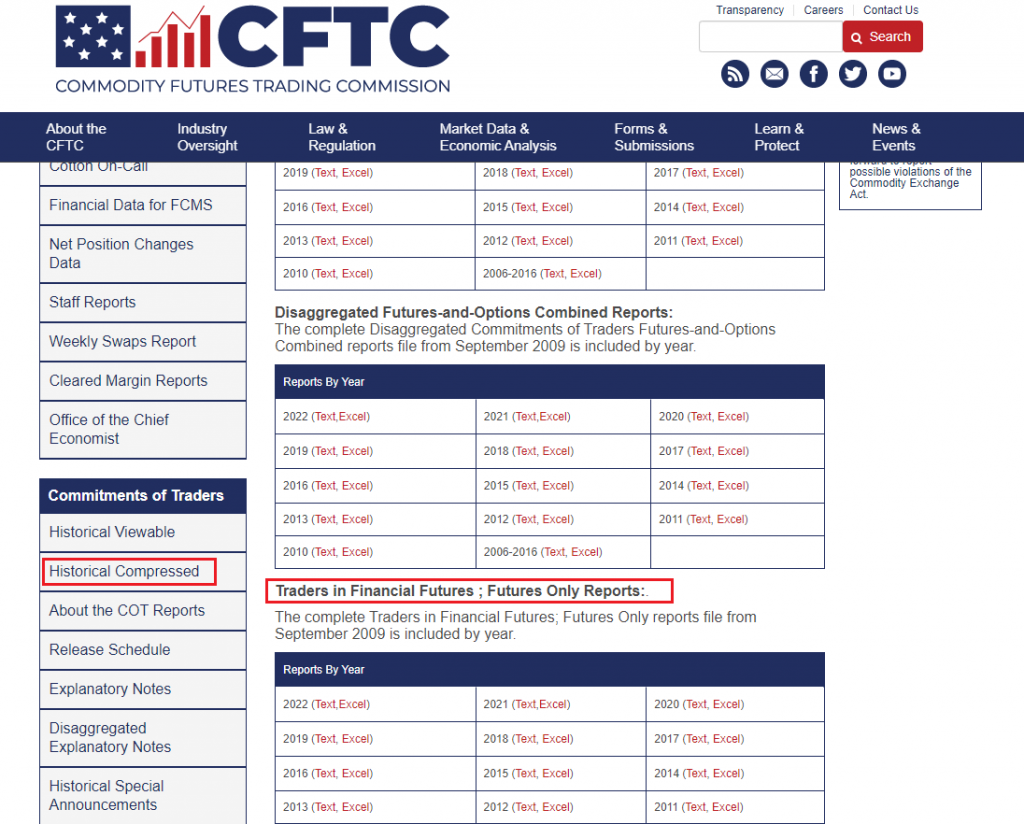
We should select the table representing Traders in Financial Futures; Futures Only Reports. Then, we can download in excel the details needed for conducting the analysis and charting the COT. Basically, when opening the excel file, the raw format of the COT should look something like this:
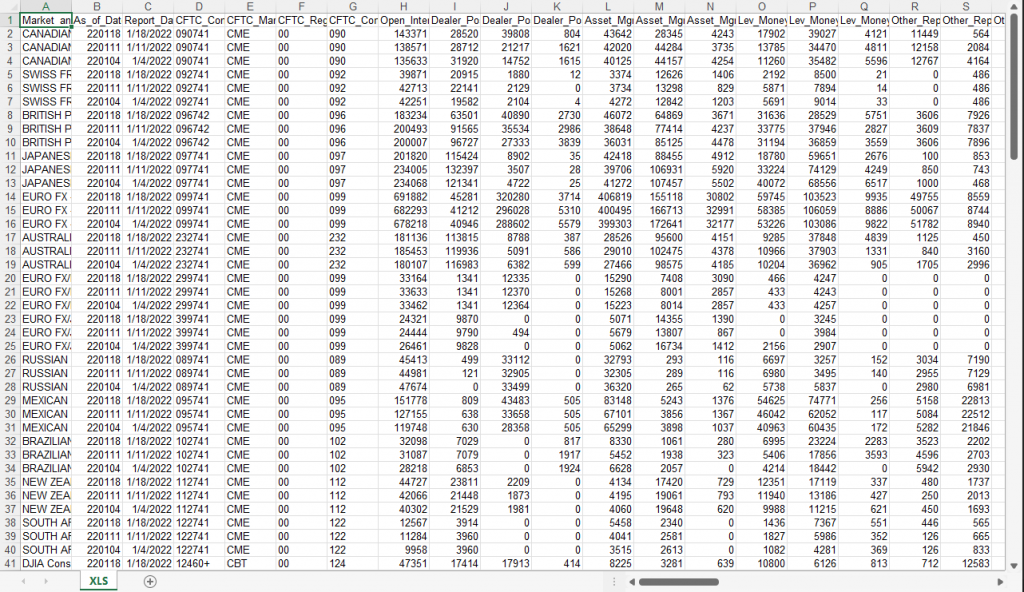
We need to retain the following columns for our analysis which relate to the asset we are willing to analyze:
- Pct_of_OI_Dealer_Long_All
- Pct_of_OI_Dealer_Short_All
- Pct_of_OI_Lev_Money_Long_All
- Pct_of_OI_Lev_Money_Short_All
These are the four columns discussed previously which will then be used to create the net leveraged funds and the net dealers (hedgers).
Remember that, intuitively (and empirically), the long dealers series should have a negative correlation with the asset, the short dealers series should have a positive correlation with the asset, the long funds series should have a positive correlation with the asset, and the short funds series should have a negative correlation with the asset. We can either analyze the four components alone or calculate a net value using the following formulas:

It is up to the trader to choose whether to net them so that he has only two-time series to deal with or to keep the four series and make a deeper analysis. Now, the above can be done for the previous years as well. I recommend downloading the COT values from 2006-2010 so that you have enough history to apply some statistical strategies.
Using the COT Data to Understand Market Sentiment
Now, how to use the COT data? As mentioned previously, there are many strategies that can be applied with this known technique but the two most common ones are the flip strategy and the extreme strategy. Let us zoom in on the EURUSD’s COT chart as shown in the next figure.
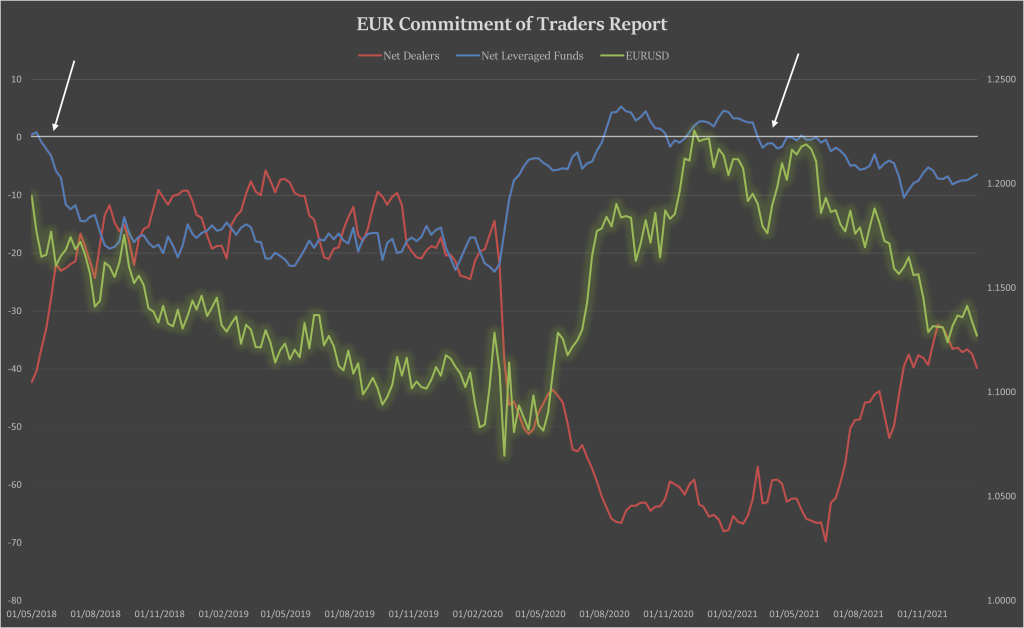
Notice how the flip from positive to negative on the net leveraged funds relates to a continued bearish trend on the EUR. Over the long-term horizon, we need more confirmation as the flip can happen many times before establishing a trend like in 2020 and 2021. Therefore, for a bullish trend confirmation, we need to see at least 4-6 positive COT values after surpassing the zero line and for a bearish trend confirmation, we need to see at least 4-6 negative COT values after breaking the zero line. The same applies to the net dealers but in reverse. Remember the intuition is that net leveraged funds are positively correlated to the market’s price while net dealers are negatively correlated to it.
The second strategy is more complex as it states that tops and bottoms in the COT values are related to tops and bottoms of the market. However, it is not always easy to detect a top or bottom on the COT. It is recommended to use volatility bands or historical highs and lows to see where the COT stands at the moment. First, take a look at the USDCHF chart below since 2008.
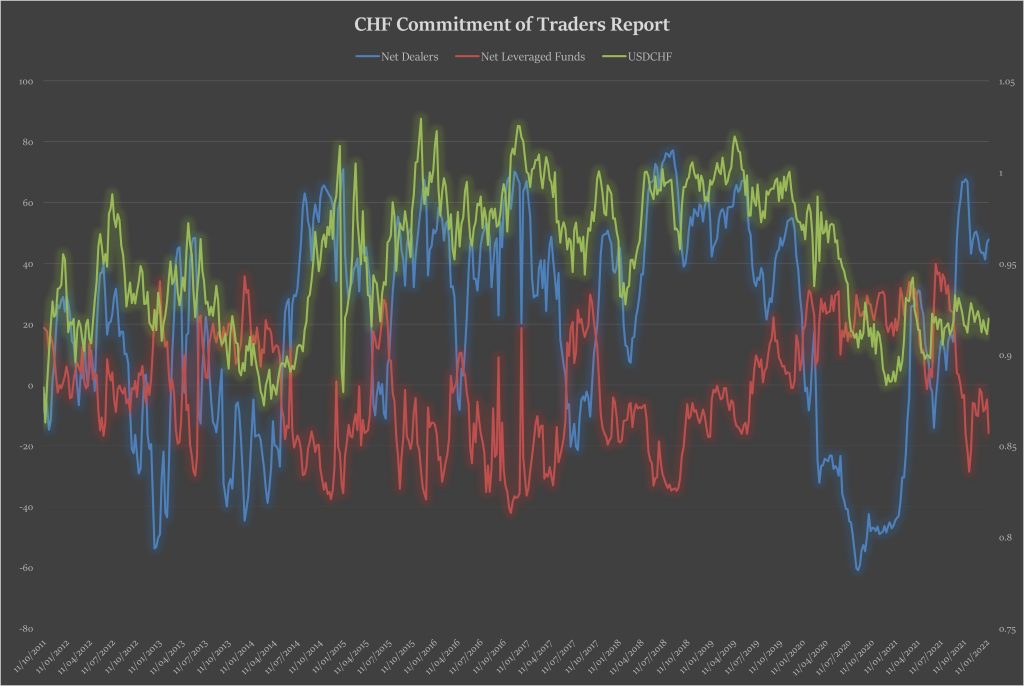
Notice how this time the USDCHF is positively correlated with the net dealers and this is because we tend to talk about USDCHF and not CHFUSD therefore, it is natural to have this correlation since the COT refers to CHF which is the price currency here and not the base currency.
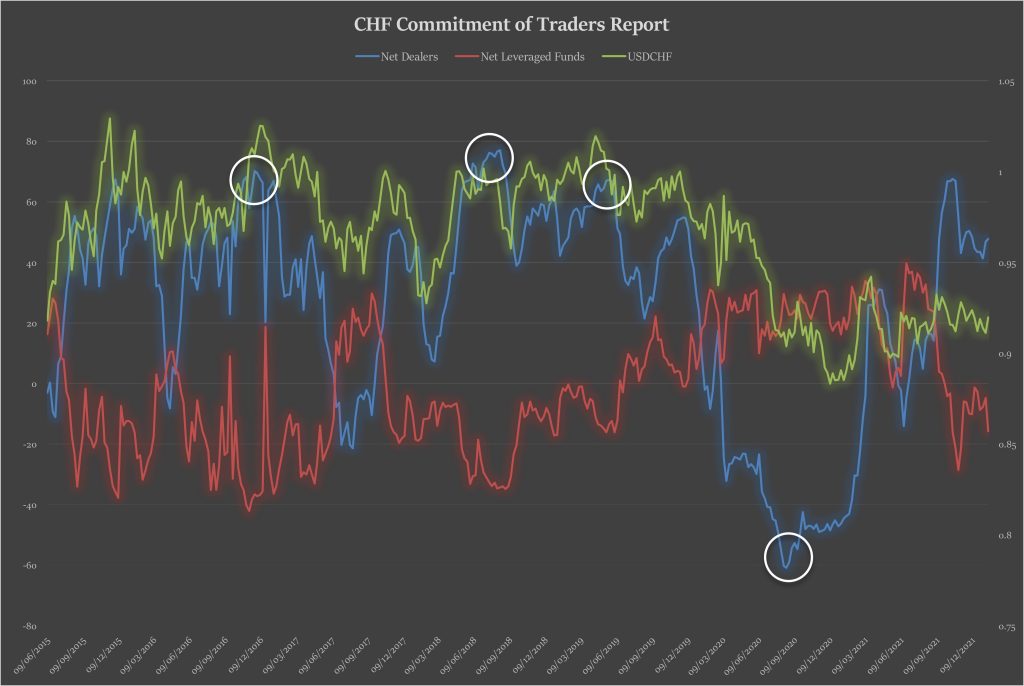
The next graph shows some tops and bottoms and how they are related to big market movements. Peaks on the net dealers are related to peaks on the USDCHF pair.
Conclusion
There you have it, a new tool in the arsenal for detecting long-term movements and predicting the markets using market sentiment. Be careful though, the COT report is not perfect and false signals are bound to appear from time to time.
For more insights into effective futures trading, read our Futures Trading Strategies Made Simple guide.