


- Gold is expected to average $1,745 per ounce in 2023.
- The real yield on US 10-year bonds turns positive.
- Fed officials maintain a more hawkish stance.
The outlook for gold (GC) futures is slightly bearish as the US dollar pushes higher. As a result of high-interest rates and a strong US currency, gold will average $1,745 per ounce in 2023, slightly below current prices, according to a Reuters poll released on Wednesday.
From a peak of $2,069.89 in March, when the US Federal Reserve hiked interest rates to contain inflation, the price of gold has dropped to roughly $1,770 per ounce.
The increased rates have made non-yielding gold less appealing by putting the real yield on US 10-year bonds positive in April for the first time in two years.
Additionally, higher rates have increased the value of the US dollar to levels not seen in 20 years, raising the cost of gold for buyers using other currencies. Moreover, investors looking for a secure store of value that might otherwise buy gold are drawn to the rising dollar.
The median predictions from a poll of 35 analysts showed that gold will cost $1,770 on average per ounce in the quarter of July to September, $1,750 in the fourth quarter, and $1,745 in 2023.
“The US dollar’s dominance and the rise in real US bond yields are weighing on the mood in the gold market,” said Julius Baer analyst Carsten Menke.
According to Fed Chair Jerome Powell, the central bank may consider another “unusually significant” rate hike at the September meeting. At the same time, some Federal Reserve officials have become more hawkish recently, considering a 75bps rate hike.
Gold (GC) futures technical outlook:
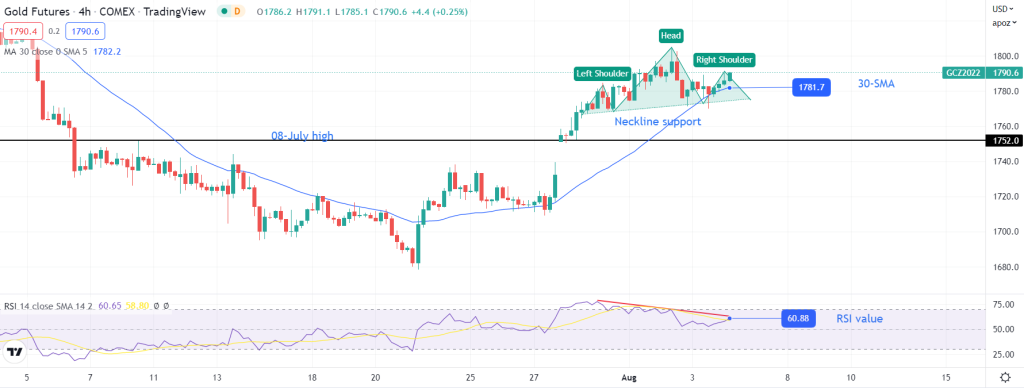
Looking at the 4-hour chart, we see a head and shoulders pattern forming, and the price is attempting a break below the 30-SMA. This pattern will play out if the price resumes its downtrend and breaks below the neck, which is the support line. The immediate support below the pattern emerges at $1758.40.
At the same time, a clean break below the 30-SMA would confirm a change in sentiment from bullish to bearish, favoring the pattern. The RSI supports the pattern as it has made a bearish divergence, showing the bullish move has weakened.
