

- Higher inflation means more rate hikes, which could destroy the global economy.
- The slowed factory activity in Asia damped Shanghai’s reopening.
- Risk sentiment could go lower and the dollar higher amid the panic.
- Prices could continue the downtrend on the charts.
Analysis of the E-mini S&P 500 (ES) futures price suggests a mildly negative scenario as inflation concerns deteriorate and lowers risk sentiment.
On Wednesday, stocks struggled in Asia while the US dollar went up as inflation rose. Investors worry about the global economy, which will be destroyed further by rate hikes meant to control this inflation monster. The S&P 500 futures gave up early gains, but they were last up 0.4%.
Shanghai opened up today, but the good news was dampened because Asia’s factory activity slowed in May as the lockdown reduced demand. Food prices and energy costs pushed inflation to 8.1% in the Eurozone, adding concerns about rising rates in Europe and globally.
“Markets are pricing in rate hikes in June from the UK, the US, Sweden, Australia, and Canada,” said Juckes Kit, a Societe Generale analyst.
“The more the markets focus on the inflation data and central bank action, the more likely we have a bumpy start to the summer in risk sentiment and a strong one for the dollar.”
Rising oil prices also pushed inflation higher, supported by the partial and phased ban on Russian oil. Top on the list of important things for investors was the Federal Reserve policy after the meeting between Joe Biden and Fed Chair Jerome Powell on Tuesday, which can only get tighter.
Investors will be paying attention to data from the US, including the ISM Manufacturing PMI and JOLT job openings. They will be listening to the ECB President, Lagarde, who is set to speak later in the day in the Eurozone.
E-mini S&P 500 (ES) futures technical analysis:
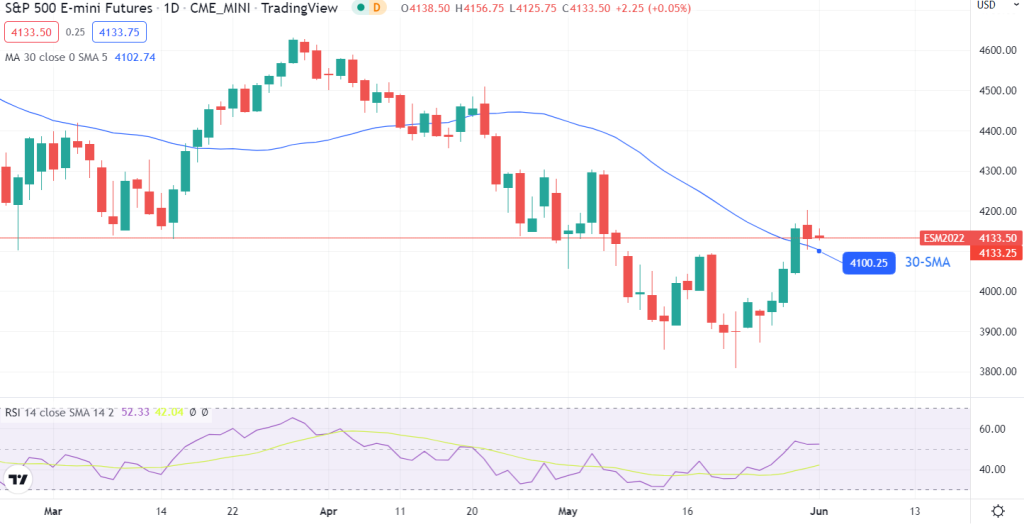
The 4-hour chart shows the price of ES currently trading at a crucial support-turned-resistance level at around 4133.50. This critical level comes after the price failed to sustain a move below 4000.00. At this level, the price could do one of two things. It could break above and confirm the start of an uptrend or bounce off and go back below 4000.00. The RSI value is above the 50.0 level, indicating a mildly positive bias for the index.
