- Investors await US jobs data for clues on Fed’s monetary policy.
- S&P 500 suffered losses in oil stocks as oil prices fell.
- On the charts, a retest of the 50-SMA could be a possibility as bulls show weakness.
The E-mini S&P 500 (ES) futures price remains range-bound ahead of the key US jobs data release. Gains in high-growth companies outweighed losses in energy equities. Investors are anticipating the monthly employment report for guidance on the rate at which the Federal Reserve may raise interest rates.
Amazon.com Inc. and Advanced Micro Devices led the tech-heavy Nasdaq to a new three-month high. Still, the S&P 500 suffered losses in oil stocks like Exxon Mobil. Oil prices fell to their lowest level before Russia invaded Ukraine in February due to concerns about the faltering global economy. US bond yields fell after the Bank of England predicted a protracted recession.
The leading indices on Wall Street had surged higher in the previous session due to solid earnings reports and an unexpected uptick in services sector activity.
“The market is looking for direction after a strong bounce that relieved the deep pessimism that had permeated the markets,” Yung-Yu Ma, chief investment strategist at BMO Wealth Management.
“Many signs indicate that inflation has peaked, and the question now turns to how quickly it will come down or whether stickier components will keep it higher than the Fed is comfortable with,” he added.
The eagerly anticipated US employment report, likely to reveal that nonfarm payrolls climbed by 250,000 jobs last month after increasing by 372,000 jobs in June, will be the main topic of discussion on Friday.
Any indications of labor market strength could fuel concerns about the Fed taking drastic action to reduce inflation.
E-mini S&P 500 (ES) futures technical analysis:
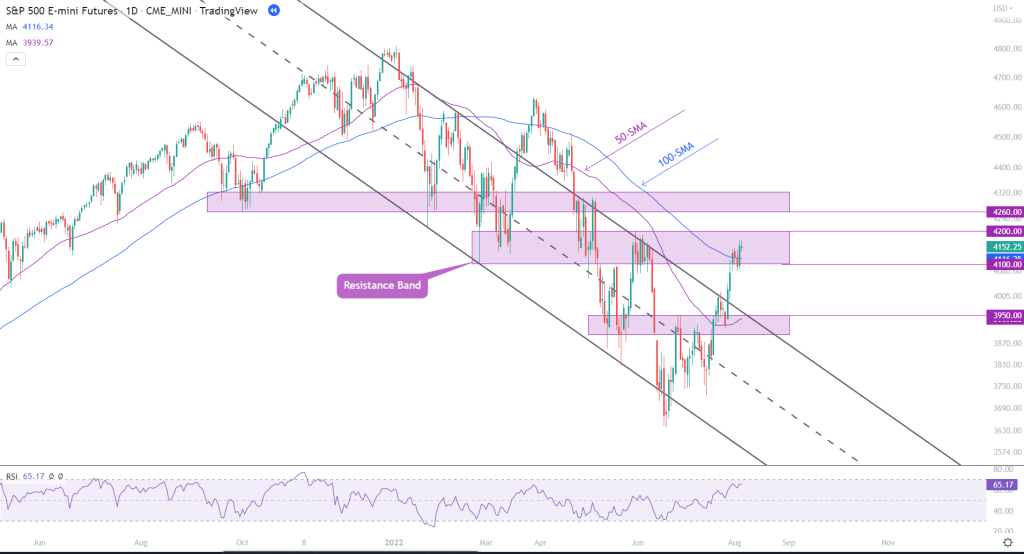
The trend channel that has been intact on the E-Mini S&P 500 futures chart since the start of the year has been broken to the upside, with prices closing above the upper trend line on the 27th of July. Once trading resumed the following day, prices rallied sharply, closing with a 1.50% gain and confirming the bullish break in the near term. The widely followed index has been falling since the top was made back on the 4th of January this year, with a total decline of 24.3% as the federal reserve began raising rates aggressively.
The sentiment seems to have changed for the time being, with the market recovering 14% from its lows with the Fed stating in their most recent meeting that they would take a more dovish approach to monetary policy. The index is currently trading inside a strong band of resistance between $4,100 and $4,200. Prices are also consolidating on the 100 SMA, which hasn’t happened since the start of April. Moving forward, we may see a sustained consolidation period as markets anticipate today’s Jobs report.
Keys levels to watch for is $3950 which would be a retest of the 50-SMA and the upper side of the trend channel. If the Jobs report comes in better than expected, we could see the index rally to as high as $4,260 over time, which is the next area of resistance.