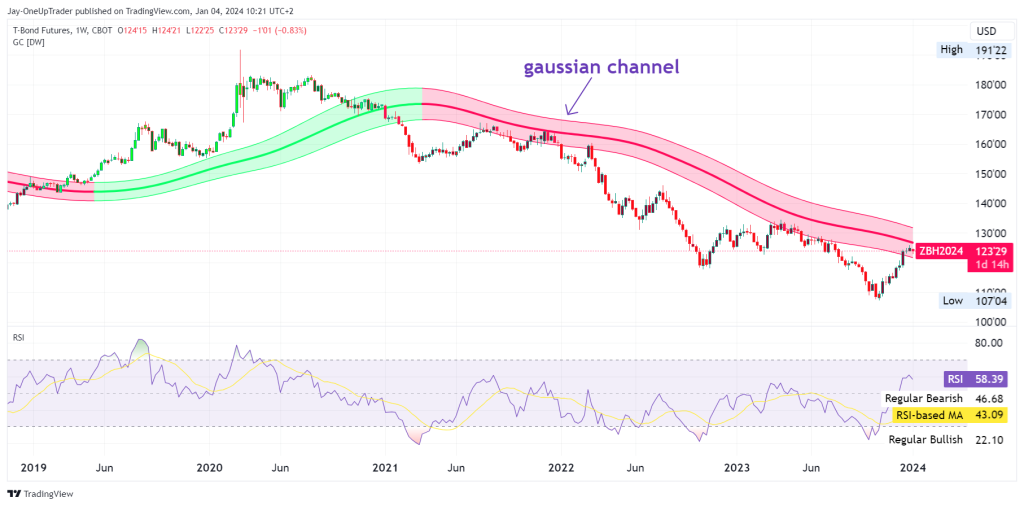
Weekly Chart
Starting with the weekly chart, the Gaussian channel is signaling a bearish trend as the price is trading below the midline of the channel. This can be interpreted as a downward pressure on the price. The Gaussian also turned red in the middle of 2021 and has been that way since. The current RSI reading is 58.39, which is in the neutral territory, but leaning towards the overbought side, hinting that there might be less room for upward movement before we encounter some selling pressure.
Daily Chart
On the daily chart, the price action is currently occurring below both the 50-day SMA (117’17) and the 100-day SMA (116’26), reinforcing the bearish outlook. However, the recent upward move towards these averages could signal a possible retest. There is also a golden cross that has occurred but since moving averages are lagging indicators, we should be careful of looking at that as a buy signal especially since the rally has already happened since November of last year.
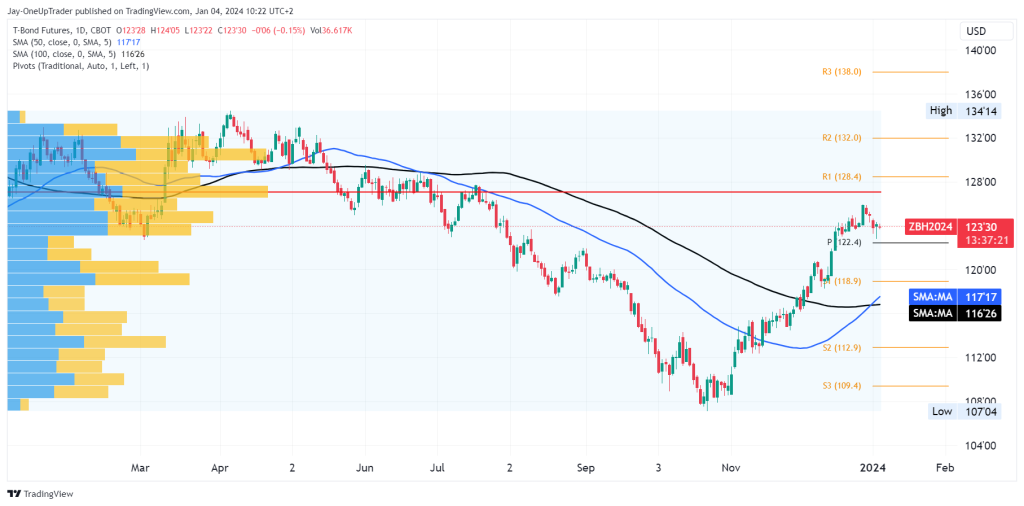
Bearish Bias Trade:
Given the bearish trend indicated by the Gaussian channel on the weekly chart, we might consider a short position. We would target the pivot point (P) around 122’4 as an initial level where the price might struggle past. A stop loss could be placed above the most recent swing high.
Remember, the probabilities are our guide here. We’re not forecasting with certainty but rather positioning ourselves where the technicals give us the edge. It’s essential to monitor these levels, be flexible, and ready to adapt to new information as the market provides it. Trade smartly, manage risks effectively, and be decisive with your execution.