


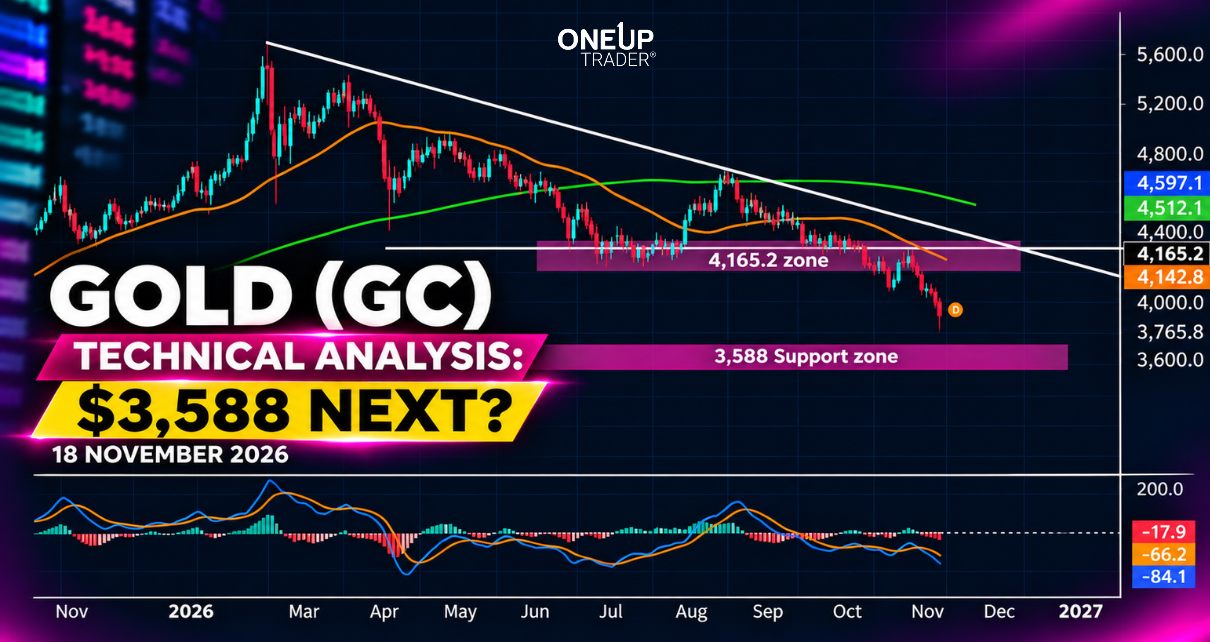
Introduction
Gold futures have broken below $4,000 again, and this time the selling has taken price beneath the low we were watching in our 5 November analysis. That recovery depended on buyers defending $3,884.90, so the bullish setup from that article has been invalidated.
Strong Dollar, caused by expectations of higher interest rates in the near term, and easing geopolitical risk have all contributed to the sell-off in gold.
The next Fed meeting is on the 8th of Decmber and there is a 95% probability that we will see a rate hike. Because of this, the market conditions are difficult for gold to rally.
What is the daily chart telling us?
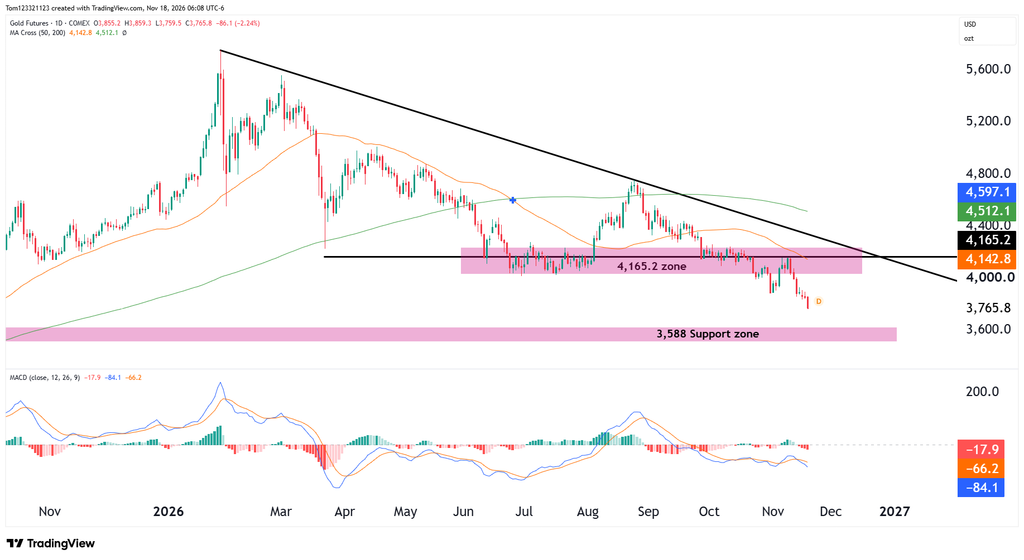
The clearest technical signal we can see on the daily chart is the support zone at $4,165.2, which has failed. The bears are in control of the yellow metal and the next zone they are zoning in on is the $3,588 level. This level goes back to May of 2025 just before we saw the parabolic move which sent gold to a high of $5,752 in January of this year.
The moving averages also favour the bears. The 50-day average at $4,142.80 is falling and sits below the 200-day average at $4,512.10. Meanwhile, the descending trendline from January’s high continues to cap any rally attempts.
MACD is below zero and has turned back beneath its signal line, with the histogram negative again. Taken together with the new price low, momentum has yet to show a convincing turn in the bulls’ favour.
Possible GC trades
Short setup: If gold rallies back toward $4,000, traders can watch the hourly chart for a lower high and rejection below that level. A stop above the rejection high would define the risk, with the latest low near $3,760 as the first target and $3,588 further down if selling continues.
Long setup: If price reaches the lower support zone, bulls can watch for an hourly reversal followed by a higher low. A stop beneath the reversal low would define the setup, with $3,760–$3,800 as an initial recovery area. This would be a trade against the daily trend, so confirmation matters.
Gold can rebound sharply even during a falling market. Avoid chasing the latest red candle, and reduce position size when the setup requires a wider stop.
For educational purposes only. Futures trading involves substantial risk, and stop orders do not guarantee an execution price.