Introduction
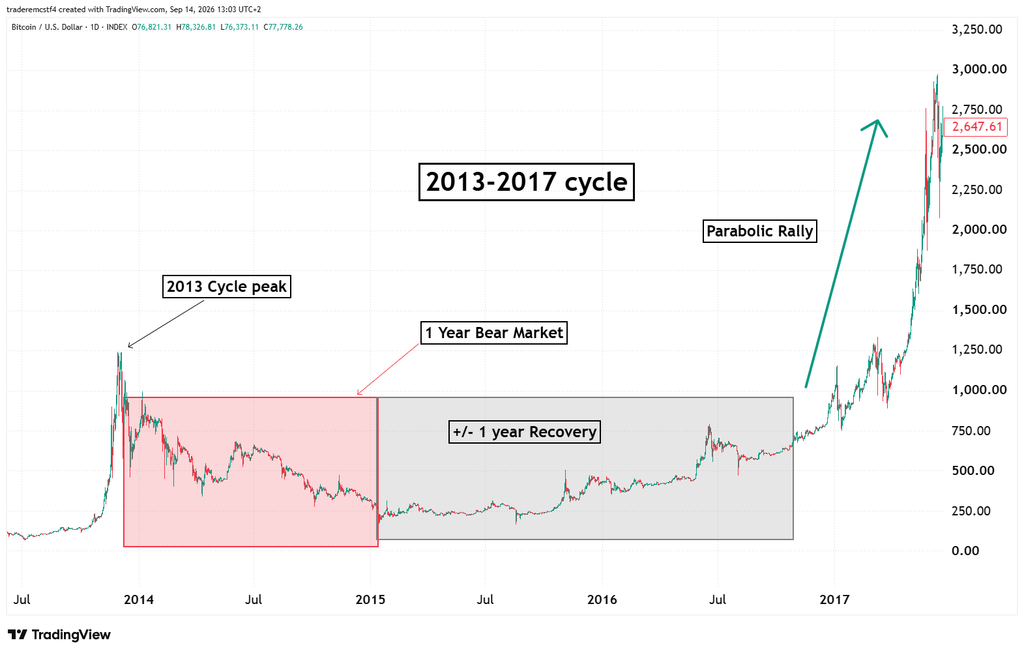
Are we about to see the start of the next bullish move in Bitcoin? It has been nearly 12 months since the last Bitcoin peak. The previous major bear markets lasted roughly 12–14 months from peak to bottom, and if the cycle repeats itself, we are approaching that time frame within the next month. This means that it could be a good time to start dollar cost averaging in.
Looking further into the cycle, it doesnt mean that suddenly after 12 months of a bear market that we get a bull market rally, it normally goes through a recovery phase. Look at the charts below as an example.
Get 20% Off An Evaluation By Starting Now!
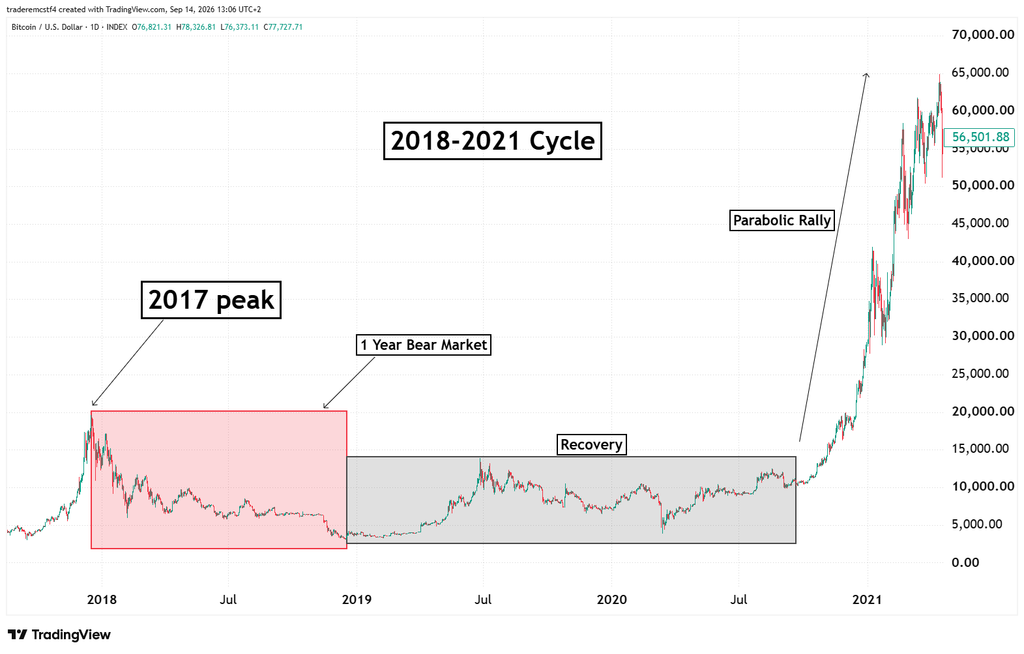
If this pattern repeats itself, then it would mean that now and for the next 6-12 months would be the accumulation phase for the likes of Bitcoin and Ethereum.
Technical Analysis
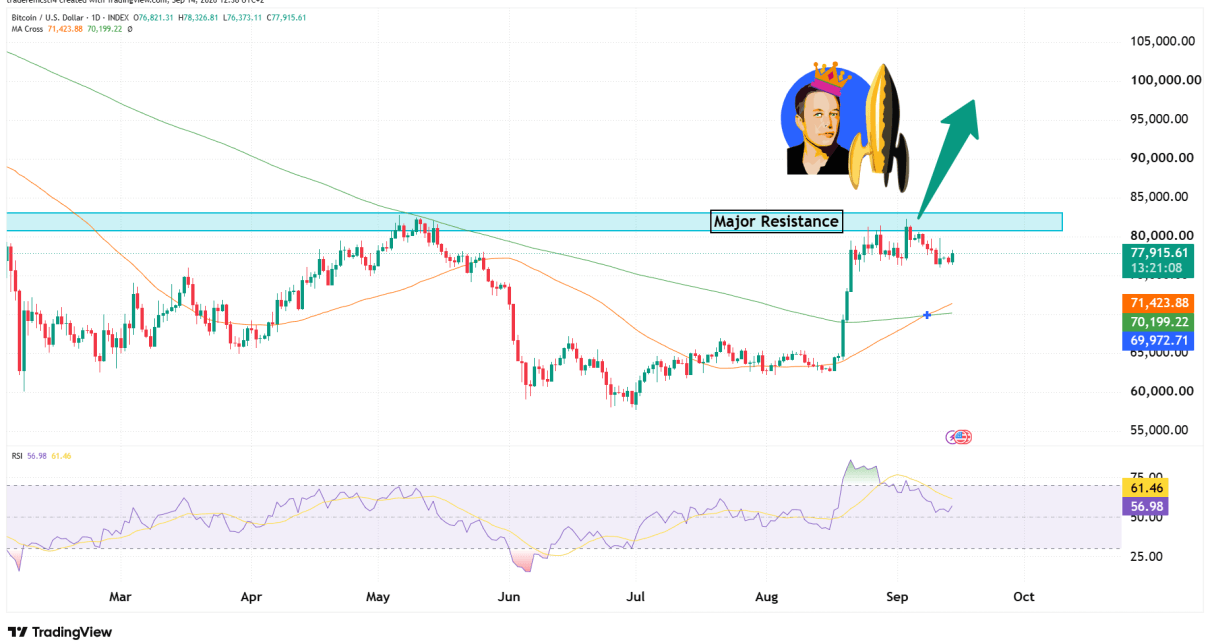
With this in mind, the technicals are giving us clear levels to watch for. Mainly the $82,000 resistance level, which, if broken, could lead to a move to $100,000.
The 50 MA has also crossed above the 200 MA for the first time in nearly a year.
BULLS WANT TO SEE PRICE REMAIN ABOVE $76,000. HOWEVER, A DROP BELOW THAT COULD MEAN A BEARISH TARGET OF $68,000.
This analysis is for educational and informational purposes only and does not constitute trading advice or a recommendation to buy or sell any futures contracts. Futures trading involves significant risk and may not be suitable for all investors. Always conduct your own research and consult with a licensed financial professional before making trading decisions.