Introduction
A trend line channel strategy uses two parallel lines. One connects your swing points and defines the trend. The other is projected across the price action and marks where the next swing is likely to stall and swing. You enter on a pullback to the trend line and take profit at the opposite line.
Trend channels work on any time frame and any liquid market. Some markets that ‘trend better’ will have a higher number of trend channels that work over time compared to markets that don’t.
It also fits the rules and requirements of a prop firm evaluation. Entry, stop, and target are all on the chart before you take the trade, so you can size against a fixed loss limit instead of guessing, and this is very important in funded trader programs.
Trend channel overview
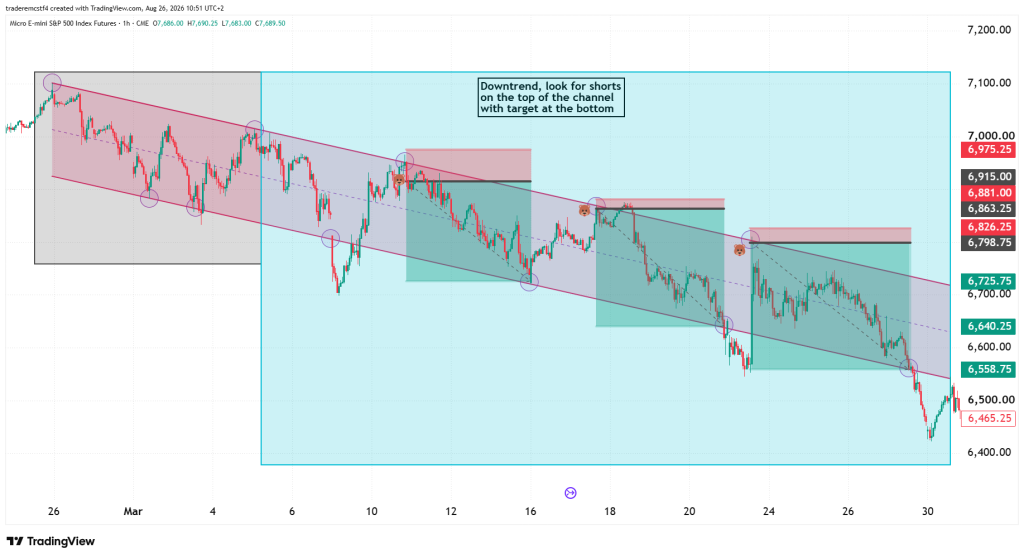
In the chart below, we have a downtrend inside the pink trend channel. The price hits specific points of that channel. Let’s start by looking at the grey box area on the left. No trades are possible to take at that time because the trend channel will be drawn from those points. Once we have two consecutive points, we have a channel. In the light blue box, all of those trades can be taken, and so we look for candlestick reversals at those highs, and we have a defined stop loss to go above those highs with a target at the low of the trend channel. This usually gives a very favorable risk-to-reward ratio.
The great thing about trend channels is that they can be incorporated into any trading strategy and don’t have to be traded on their own. For example, if you are trading a scalping strategy, you can identify if the market is currently in a trend channel and only take scalps in the direction of that channel.
What the channel gives you
Direction and slope. The trend line shows which way price is moving and how fast. A steep channel on NQ means each pullback gets bought fast, and you get less time to enter. A shallow one gives you room to rest a limit and wait.
Slope also tells you when a move is accelerating. If you keep having to redraw the trend line steeper to keep price inside it, the move is speeding up. That usually happens late, not early. Late acceleration tends to end in a sharp snap back through the channel, so entries taken there carry more risk of an immediate reversal than entries taken while the slope was steady.
Range. The channel line estimates how far the next swing can travel before it runs out of buyers or sellers. That’s your target, and it’s what makes the tool useful for exits, not just entries.
Location. Where price sits between the two lines tells you whether you’re early or late. Buy near the trend line in an uptrend and your stop is close while your target is the full width. Buy in the middle and you’ve given up half the move for the same risk. Same setup, worse math.
A level that says you’re wrong. When price closes and holds outside the trend line, the swings that built the channel have stopped repeating. You don’t have to decide in the moment whether the trend is over. You have a line to trade against.
Measure the width before you take the trade
A channel is only worth trading if it’s wide enough to pay for the stop.
Width is the distance between the trend line and the parallel channel line, measured in ticks. That distance is roughly what a move from one side to the other is worth. Your stop sits a few ticks beyond the trend line, so the width has to cover that stop with room left over.
Do it before the entry, not after. Two numbers:
- Target: channel width in ticks, minus a few ticks, so you’re not depending on price tagging the exact top.
- Risk: distance from your entry to your stop, in ticks.
If the target isn’t at least twice the risk, the channel is too tight to trade. A 40-tick channel on NQ with a 25-tick stop leaves you paying 25 to make maybe 30. That’s a trade you can win most of the time and still finish flat.
Width also has to clear normal noise. If NQ is swinging 15 ticks in a minute and your channel is 30 ticks wide, price will hit both sides on chop alone. The channel isn’t describing a trend at that point — it’s describing the spread.
Measure the vertical distance between the two lines at the current bar, then convert it:
| Contract | Per tick | Per point |
|---|---|---|
| NQ | $5.00 (0.25) | $20 |
| ES | $12.50 (0.25) | $50 |
| CL | $10.00 (0.01) | $1,000 |
A 40-point channel on NQ is $800 of movement per contract. If your stop needs 15 points to sit behind the swing low, you’re risking $300 for a target of $800. A 12-point channel with the same stop is $240 of room against $300 of risk. That one isn’t a trade, no matter how clean it looks.
What it doesn’t give you
Timing. The channel tells you where, not when. Price can sit against the trend line for six bars before it turns, and your stop has to survive that. This is why it is recommended to place the stop a few points higher than the high, if shorting, like in the chart below.
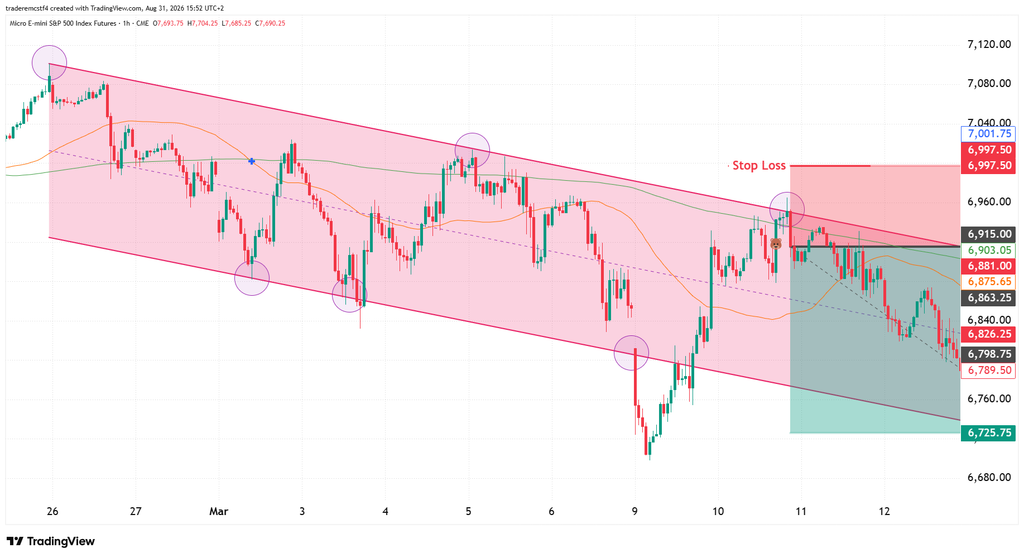
And the touch is an estimate, not a level. Price often stalls short of the channel line, and sometimes it runs straight through. Treat it as a zone. Take partial size into it and trail the rest behind swing lows if the move keeps going.
One caveat before you draw anything
In hindsight, every channel looks perfect. In real time, you’re drawing off two swings and adjusting as candles print. You’re not looking for a channel that contains price forever. You want one drawn by the same rules every time, which holds more often than not, and you’re willing to move when it stops fitting.
This is important because the process needs to be repeatable. It means that you are not making decisions out of hope or fear because you know exactly what you are looking for each time.
How to draw a trend line channel
Step 1: Mark the swings
A swing high is a bar with lower highs on either side. A swing low is a bar with higher lows on either side. Pick a way you define the way you draw the channel and use it on every chart, every session.
Step 2: Connect two swings
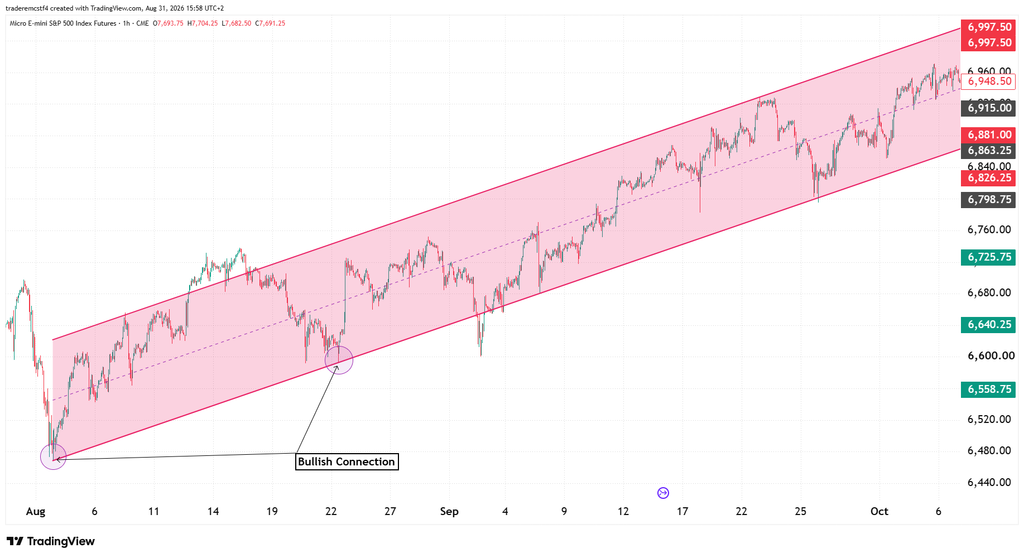
For a bull channel, connect two swing lows. The second must be higher than the first.
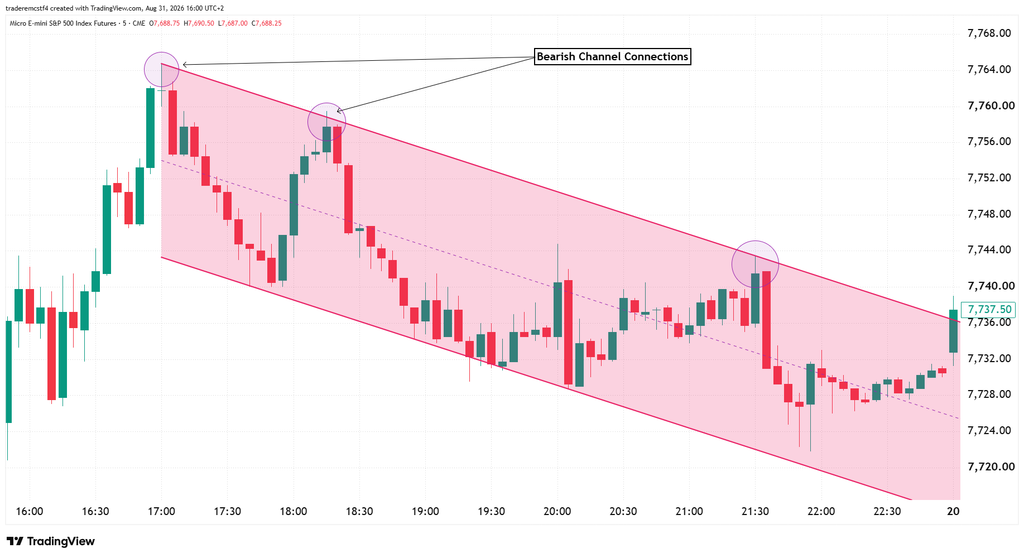
For a bear channel, connect two swing highs. The second must be lower than the first.
Step 3: Project the parallel line
Copy the trend line and anchor the copy to the most extreme point between the two swings you used.
- Bull channel: anchor to the highest high between the two swing lows.
- Bear channel: anchor to the lowest low between the two swing highs.
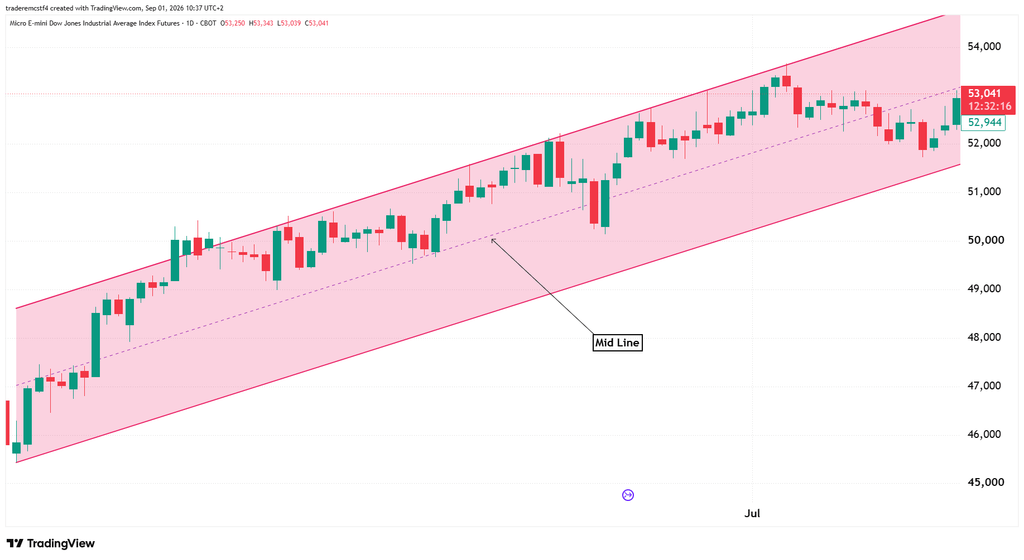
That parallel is your channel line and your main target. It is also possible to target the midline of the channel. This can be done in a few ways, exiting the trade at the mid line completely, taking a partial (50% off at the mid line), or just moving the stop loss to break even.
| Event | Long | Short |
|---|---|---|
| Slope | Up | Down |
| Trigger | Pullback to the bull trend line | Rally to the bear trend line |
| Conservative entry | Buy stop above a bullish bar or pattern | Sell stop below a bearish bar or pattern |
| Aggressive entry | Buy limit just above the line | Sell limit just below the line |
| Stop | Below the swing low that anchored the line, or a volatility stop | Above the swing high that anchored the line, or a volatility stop |
| Target | Opposite channel line | Opposite channel line |
Conservative entries cost you ticks and filter out some losers. Aggressive limits get a better fill and put you in front of moves that never turn. Pick one, log the results, and don’t switch based on your last trade.
Where the trend line channel strategy fails
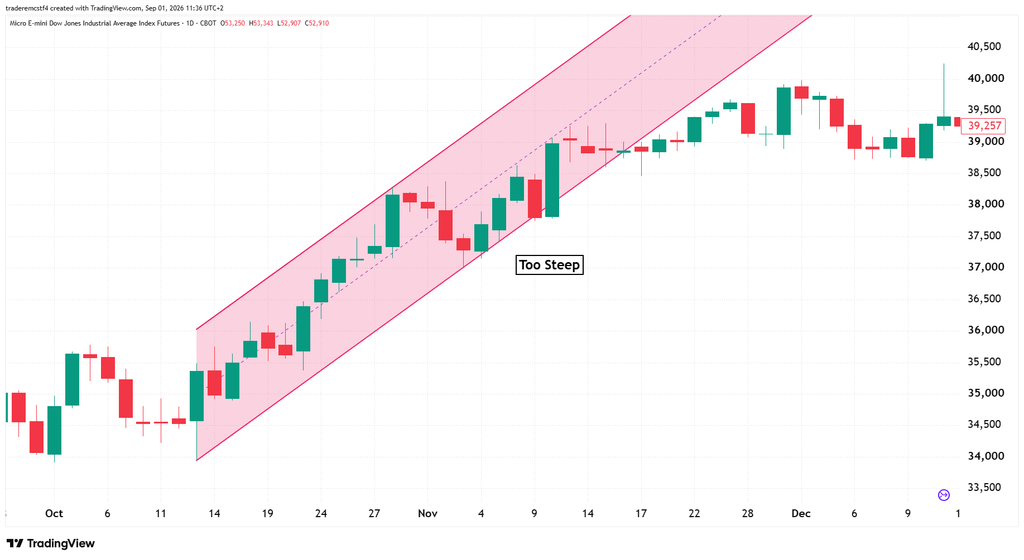
Steep channels. Anything much past 45 degrees is running on momentum. Pullbacks tend to be deep, and a pullback that reaches your trend line often keeps going.
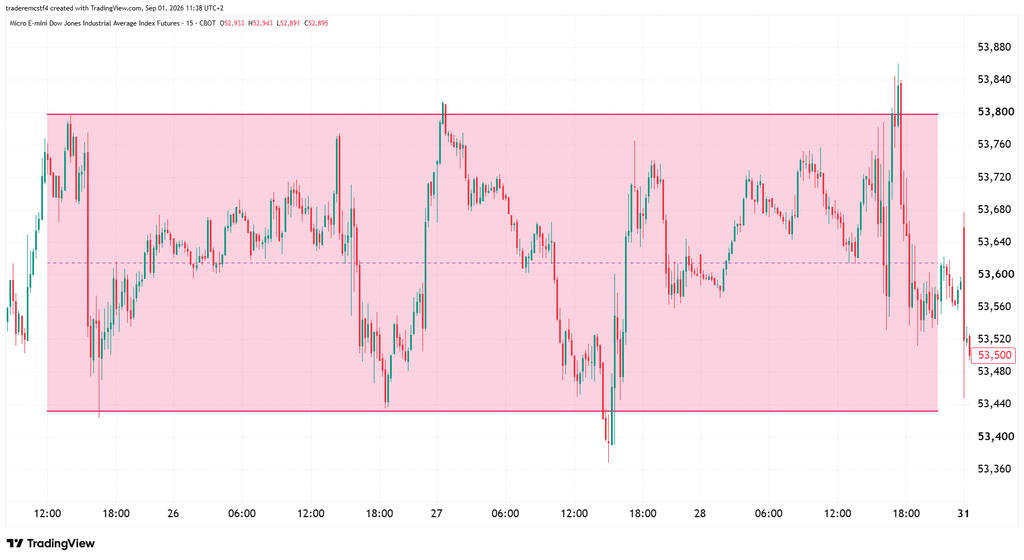
Shallow channels. A near-flat channel is a range-bound market. It should be traded as that or skip it.
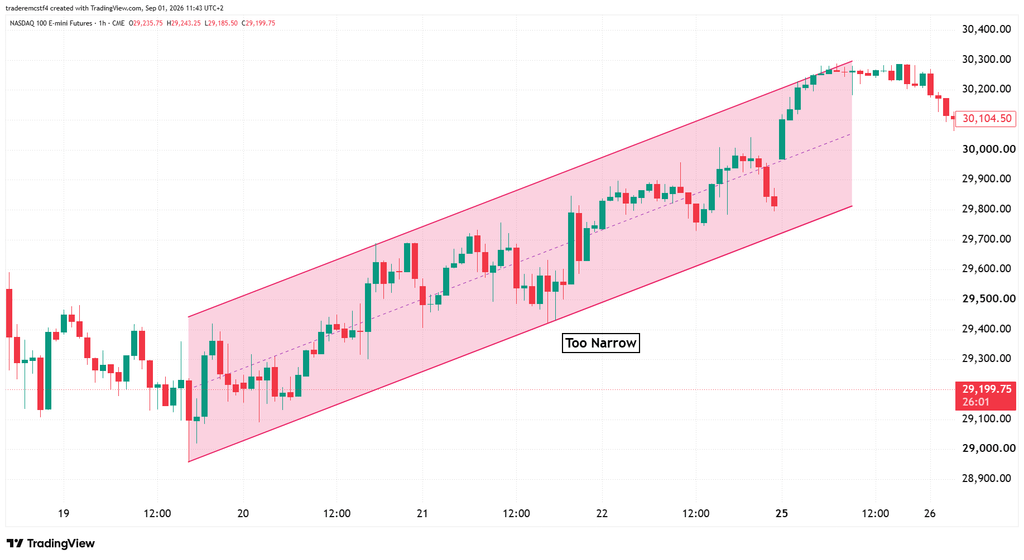
Narrow channels. Compare channel width to the average bar range. If the channel is thinner than two wide-range bars, the target won’t pay for the stop plus fees. On NQ, one point is $20 per contract — a 12-point channel is $240 of room, and your stop may eat most of it.
Trading channels inside a funded trader program
In an evaluation or a funded account, you’re trading simulated capital under a fixed loss limit. That changes execution, not the setup.
- Size from the stop. Measure entry to stop in ticks, convert to dollars, then choose contract size.
- Never widen a stop to save a channel trade. Your drawdown doesn’t widen with it.
- One instrument, one time frame. while you’re learning to draw these in real time. Two charts mean two sets of swings and twice the chances to force a line. Keep it simple and trade the instrument that you already know. All markets move differently, and sticking to what you are used to can give the best results, especially in evaluations.
FAQ
What time frame works best for trend line channels?
The one where your swings are clean and spaced out. The drawing rules are identical on a 5-minute chart and a daily chart. If you have to squint to find the swing points, drop to fewer bars or move up a time frame.
How many touches make a trend line valid?
Two swings draw it. A third touch that holds is your confirmation. Every touch after that adds traders watching the same line, which cuts both ways — more reaction, and a sharper move when it finally breaks.
Should I use a limit or a stop order at the trend line?
Limit gets you a better price and no confirmation. Stop above or below a reversal bar costs ticks and skips the trades that slice straight through. Aggressive entries need a tighter stop rule because you have no pattern to hide behind.
Can I trade the channel break instead of the pullback?
Yes, but it’s a separate strategy with its own entry, stop, and target. Decide which one you’re trading before you enter. Switching from pullback to breakout mid-trade is usually just a way to avoid taking a stop.
| Information | Quick Links |
|---|---|
| How the evaluation works | https://help.oneuptrader.com/article/365-steps-to-getting-funded |
| tick values by contract | https://www.cmegroup.com/education/courses/introduction-to-futures/tick-movements-understanding-how-they-work |
| size your position against the loss limit | https://blog.oneuptrader.com/trading-tips/mastering-risk-management-in-funded-trading-accounts/ |