


Introduction
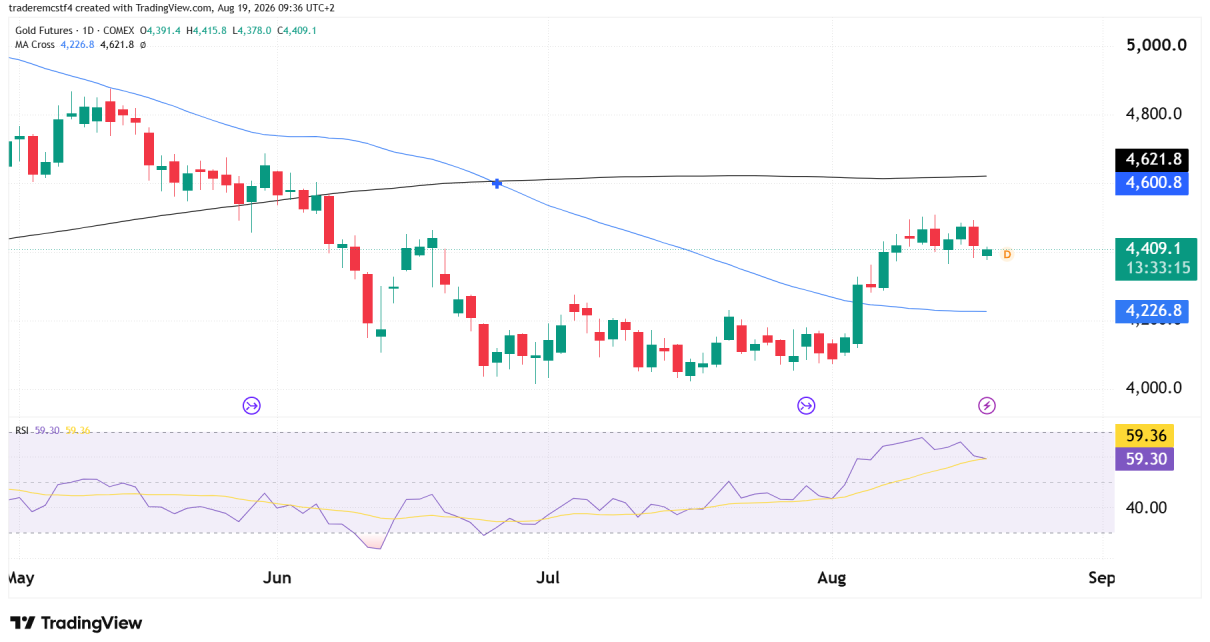
When we covered the metal on August 11, price sat at 4,432 after a 7.6% run, and the setup was straightforward: a close above 4,500 opened the 4,600 cluster, while a rejection there followed by a close below 4,415.8 set up a pullback toward 4,300. Price reached roughly 4,495, turned five points short of the trigger, and has spent the six sessions since going nowhere. The August 19 session closed at 4,405.4 — just beneath that fade level.
Lets take a closer look at the technicals and what they are telling us.
Trend Analysis
The floor from end of June – the start of August is the strongest bullish feature for Gold right now. With that said, there is still a lot of work the buyers need to do in order for this to turn into a meaningful rally. We need to see GC futures close above $4,500 and then move to test the 200 MA.
Bears will be trying to push price down again to test that floor at $4,100.
The Yield Problem, in Context
Gold has every reason to be higher and is not, which is the part worth understanding:
- Rate expectations still favor gold. Weak employment data, moderate inflation prints, and the retail sales miss have pushed the probability of a September Fed hike to roughly 35%, down sharply from the mid-50s a fortnight ago. Record central bank buying continues underneath.
- Treasury yields are the offset. The 10-year has reached a one-year high above 4.7% and the 30-year hit fresh 19-year highs above 5.3%. Higher yields raise the cost of holding a non-yielding asset, and safe-haven flows have been going into Treasuries and the dollar rather than into gold.
- The geopolitical picture escalated rather than resolved. The 60-day memorandum of understanding between the U.S. and Iran expired on Monday with the peace process stalled, a vessel was struck in the Strait of Hormuz, and Tehran has announced a shift to a fully offensive posture.
The bigger picture: two forces are pulling in opposite directions, and the same oil-driven inflation expectations that should support gold are also driving the bond sell-off that caps it. That is a recipe for two-way consolidation rather than a trend, which is precisely what the chart has delivered.
Key Support and Resistance Levels
Major Resistance
| Level | Notes |
|---|---|
| 4,415.8 | Session high; former support from August 11, now capping rallies |
| 4,495 – 4,500 | August high and the round number that rejected the run |
| 4,600 – 4,622 | Marked level converging with the slower moving average, unchanged as the main ceiling |
Major Support
| Level | Notes |
|---|---|
| 4,378.0 | Session low |
| 4,300 | Breakout shelf from the early-August move |
| 4,226.8 | Faster moving average, the floor of the current squeeze |
Possible Trades
Pullback continuation
- Entry trigger: daily close below 4,378.0
- Stop: above 4,415.8
- Target: 4,300 initial, 4,226.8 extended
Reclaim and retest
- Entry trigger: daily close back above 4,415.8
- Stop: below 4,378.0
- Target: 4,495–4,500 initial, 4,600 extended — the same cluster that has rejected every attempt since June
Invalidation / range scenario
- Continued chop between 4,300 and 4,500 remains the base case while the two macro forces stay balanced
- The July FOMC minutes publish Wednesday and are the near-term catalyst, with Jackson Hole behind them — a market this evenly split is more likely to gap than to drift once new information arrives
- Escalation in the Strait can spike gold quickly, but rising yields have been capping those moves, so a headline pop is not automatically a trend
Summary
Gold has stalled beneath a level that used to support it, with momentum crossing lower and the two moving averages still bearishly aligned. The 4,378–4,415.8 band is the immediate decision zone: losing it opens 4,300, while reclaiming it puts the 4,600 ceiling back in play. With the Fed minutes and Jackson Hole ahead and yields sitting at multi-year highs, this consolidation is more likely to break on policy than on price action.
Trading futures involves substantial risk of loss and is not suitable for all investors. Past performance is not indicative of future results. This analysis is for informational and educational purposes only and does not constitute financial advice. Always conduct your own due diligence and consult with a licensed financial advisor before making any trading decisions.

