

Introduction
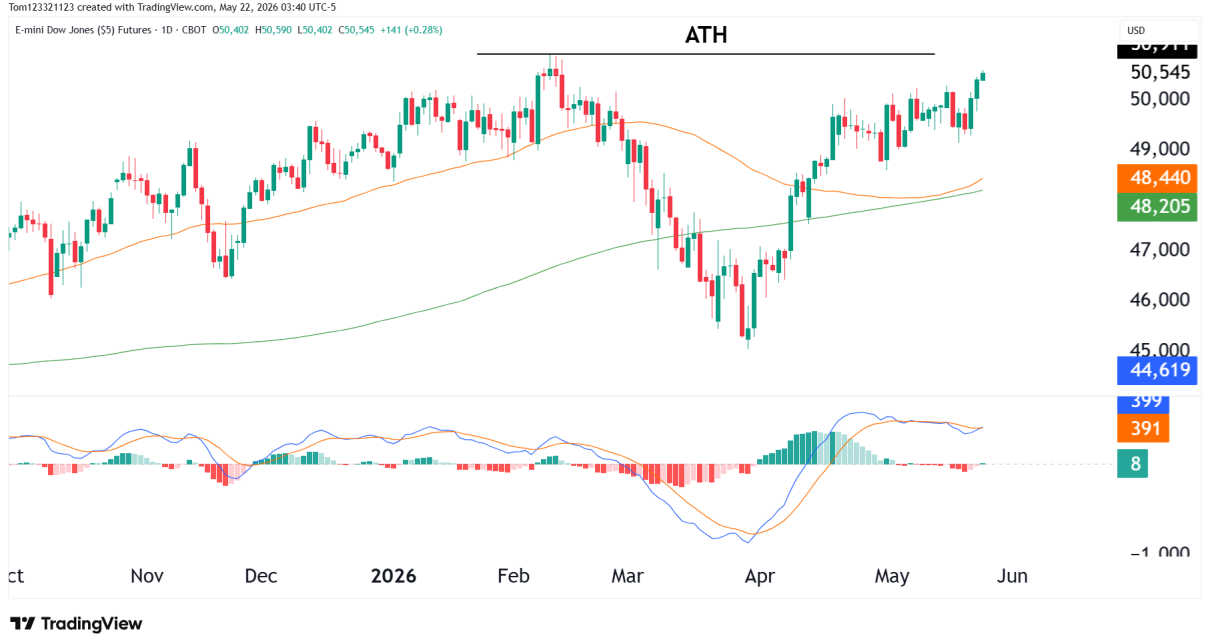
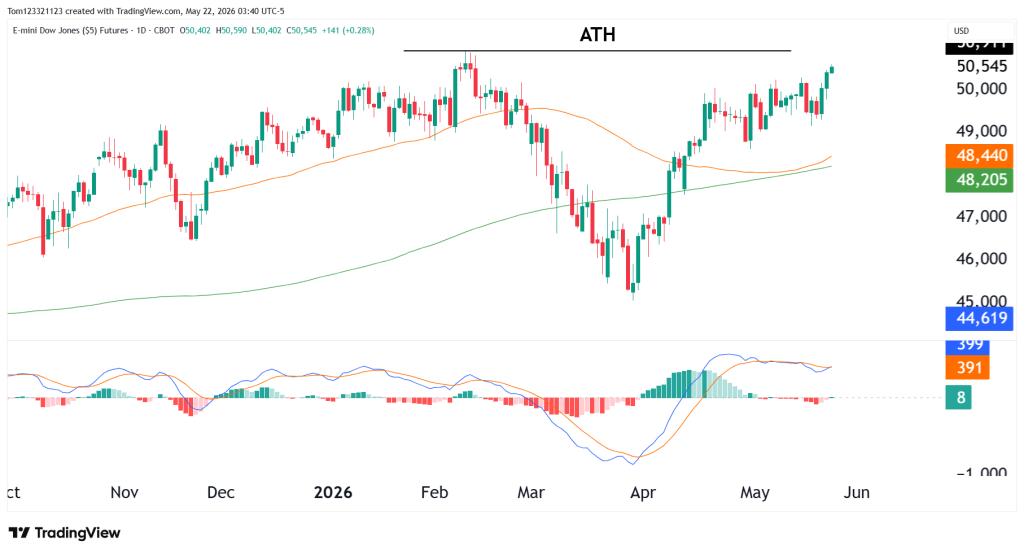
Dow Jones futures continue showing bullish momentum as YM pushes back toward the all-time highs near 50,900. Following the sharp correction during March and early April, buyers stepped back into the market aggressively and have now nearly recovered the entire decline.
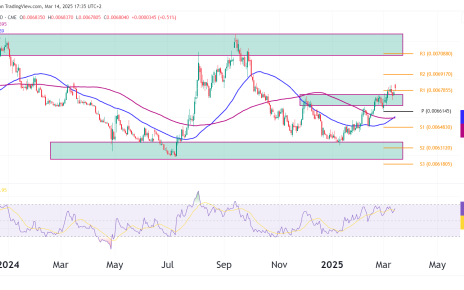
The current daily chart shows Dow futures trading firmly above both the 50-day and 200-day moving averages while momentum continues building toward the previous ATH resistance zone. Industrials have remained relatively strong, dropping fewer percentage points than other US indices during March, but also rallying fewer percentage points now. (See our video below.)
Dow Jones Futures Trend Analysis
One of the most important technical areas on the chart is the previous all-time high near 50,700. Price is getting close to testing that resistance zone again after recovering nearly 6,000 points from the April lows.
The current move continues showing a strong bullish structure overall, although momentum has started slowing slightly as YM approaches resistance.
Estimated Probabilities for Dow Jones Futures
| Scenario | Estimated Probability | Market Interpretation |
|---|---|---|
| Breakout above ATH toward 51,500 | 50% | Buyers maintain momentum and push into new highs |
| Consolidation below 50,900 resistance | 35% | YM pauses beneath ATH while maintaining bullish structure |
| Pullback toward 48,500 support | 15% | Profit-taking triggers deeper retracement |
Key Support and Resistance Levels
Major Resistance Levels
- 50,900 ATH
- 51,500
- 52,000
Major Support Levels
- 49,500
- 48,440 (50-day moving average)
- 48,205 (200-day moving average)
YM Possible Trades
Bullish Breakout Trade
If YM can produce strong daily closes above the 50,900 all-time high, we could see momentum accelerate quickly as buyers continue pushing into new highs. A successful breakout followed by a retest of previous resistance as support would further strengthen the bullish structure, especially if momentum continues building near the highs without aggressive selling pressure stepping in.
Pullback Trade Setup
As long as YM remains above the 50-day moving average, the broader uptrend remains intact and we can continue watching for pullback opportunities during periods of consolidation. Bullish rejection candles near support, higher low formations, and momentum recovering after shallow retracements would all continue supporting the idea that buyers remain in control of the larger trend.
Dow Futures & Market Sentiment
Dow Jones futures, like all other markets, are now sensitive to interest rates, economic growth forecasts, and risk sentiment across the globe.
The recovery across industrial and financial sectors has helped support YM’s move back toward all-time highs. However, volatility could increase quickly if economic data weakens or bond yields begin rising aggressively again.
Take Advantage of This 10% Discount & Start Your Evaluation Today!
This analysis is provided for educational and informational purposes only and should not be considered financial or trading advice. Trading futures, forex, and other leveraged financial instruments carries a high level of risk and may not be suitable for all investors. Past performance is not indicative of future results. Before making any trading decisions, conduct your own research, assess your risk tolerance, and consult with a qualified financial advisor if necessary.