


Introduction

E-mini Dow Jones futures (YM) have started to steadily decline, now testing the 200-day moving average. This could be an aftereffect of the initial phase of the escalations in the Middle East. The RSI is also hitting oversold levels so this is an important level to keep an eye on moving forward.
Equity markets often react negatively to sudden energy price spikes due to the potential impact on inflation and corporate margins. When the recent war first broke out in the Middle East, equities did not initially react, and volatility was still low. Now, as the time has gone on a bit longer, crude oil prices are above $100, and talks of possible $200 oil, equity investors are starting to balance their portfolios and take a relook at the potential risk the global economy is facing now.
Market Structure & Trend
Daily Chart – Correction Into Major Support
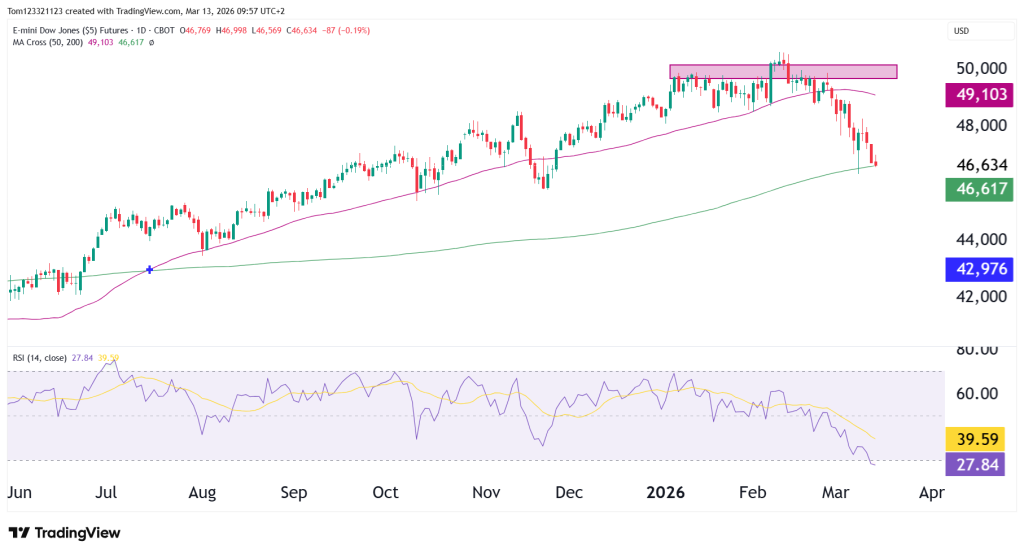
The daily chart shows a sharp correction following the rejection from the 50,000 resistance zone.
The most important level now is the 200-day moving average. This needs to hold in order for the bulls to have a chance of a short-term bullish momentum shift to occur. The RSI being oversold is not as impactful right now becuase it can stay like that for long periods of time especially in market environments like we have today.
Weekly Chart – Bull Trend Still Intact (For Now)
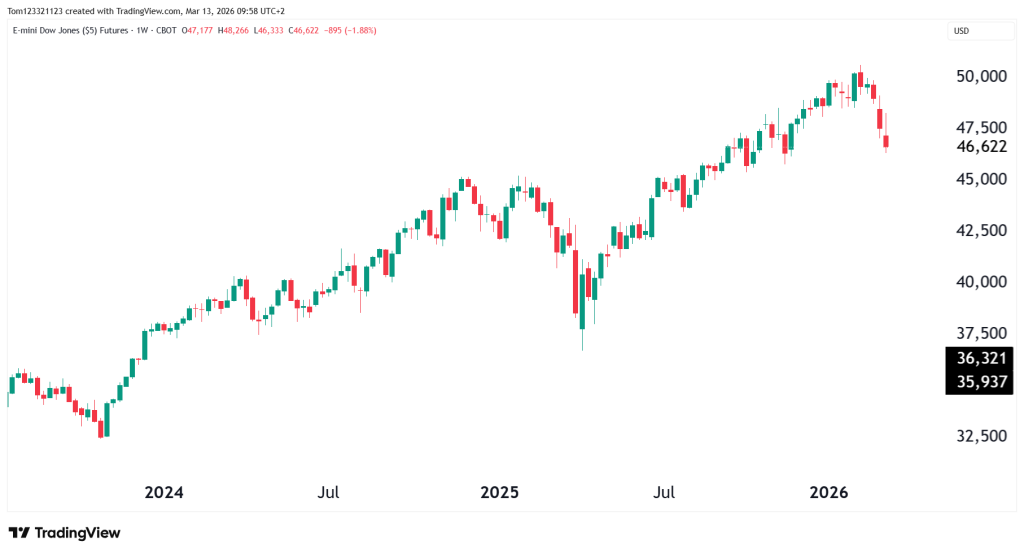
Despite the recent selloff, YM still maintains a broader structure of higher highs and higher lows that has been in place since early 2024. The drop in mid 2025 shows what can happen to YM if the selling increases.
With that said, the market is still making higher highs and higher lows overall.
Key Technical Levels for YM
Resistance
48,000 – 48,200
This area represents the first significant resistance level if YM rebounds. It also aligns with recent breakdown levels.
49,000 – 49,500
This region corresponds with the 50-day moving average and the prior distribution zone. A move back above this area would signal improving bullish momentum.
50,000
Major psychological resistance and the level that capped the previous rally.
Support
46,600
This level aligns with the 200-day moving average and is currently acting as the primary support zone.
45,000
If the 200-day moving average breaks, this becomes the next major structural support level based on prior consolidation.
43,000 – 43,500
A deeper correction could bring price back toward this broader demand area from earlier in the trend.
Scenarios Going Forward
Support Holds – Relief Rally
If buyers defend the 200-day moving average, YM could bounce toward 48,000–49,000 as short sellers cover and oversold conditions normalize.
This would likely be a rebound within the broader trend.
Consolidation Near Support
The market may spend some time forming a range between 46,600 and 48,000 while volatility stabilizes.
This scenario would allow momentum indicators to reset before the next major directional move.
Breakdown Below the 200-Day Moving Average
If geopolitical tensions escalate or equity markets continue weakening, YM could break below 46,600.
In that case, the next downside target would likely appear near 45,000, with potential extension toward the 43,000–44,000 region.
Probability Table
| Scenario | Description | Estimated Probability |
|---|---|---|
| Support Holds / Relief Rally | Price holds above the 200-day MA (~46,600) and rebounds toward 48,000–49,000 as oversold conditions trigger a bounce. | 45% |
| Consolidation Range | YM trades sideways between 46,600 and 48,000 while markets digest geopolitical news and volatility stabilizes. | 35% |
| Bearish Breakdown | Price breaks below 46,600, opening the door for a deeper correction toward 45,000 or lower. | 20% |
Final Takeaway
E-mini Dow futures are now testing a key technical level: the 200-day moving average near 46,600.
The recent drop happened after the market hit resistance around 50,000 and as volatility increased due to energy market disruptions and geopolitical tensions. At the same time, momentum indicators show the market is oversold, which means a short-term bounce could happen.
The main levels to watch are 46,600 as support and 48,000 as resistance.
How the market reacts around these levels will likely decide what happens next. It will show whether this is just a normal pullback in a larger uptrend or the start of a deeper decline.
This analysis is for educational and informational purposes only and does not constitute trading advice. Futures trading involves significant risk and may not be suitable for all investors. Always conduct your own research before making trading decisions.
