


Introduction
Gold futures (GC) ran sharply higher into early February, pushing past their old all-time highs and into new territory. That move was followed by a fast and noticeable pullback. While the drop looked dramatic, it came after a long, almost straight-up rally that left prices stretched far above their usual levels.
The pullback doesn’t look like the start of a trend reversal. It’s more likely the result of traders taking profits, adjusting positions, and reacting to short-term macro shifts. The bigger bullish trend in gold is still in place, and this volatility may help cool things off and reset momentum rather than end the move.
Gold isn’t struggling to break resistance anymore. Now it is in price discovery after a historic rally.
Market Summary
- Primary trend: Strongly bullish across all higher timeframes
- Current market perspective: Price discovery with elevated volatility
- Key support (line in the sand): $4,450–4,500
- Bias-defining level: $4,900–5,000
- Risk to the thesis: Sustained acceptance below the 50-day moving average
Why Gold Dropped So Suddenly
1. Gold was stretched in the short term
Gold had climbed very quickly without taking a break. Momentum indicators were overbought, and price had moved far above its 50-day average. In that kind of setup, it doesn’t take much selling to trigger a fast pullback.
2. Traders took profits after new highs
Once gold pushed past its old all-time highs, there was no clear resistance above. That often invites profit-taking, especially from trend-following funds, momentum strategies, and large speculative traders trimming exposure. This kind of behavior is common after sharp, almost vertical moves in futures markets.
3. The dollar and yields caught a short-term bid
Even though the bigger trend in the U.S. dollar is still weaker, a brief stabilization in the dollar and a pause in falling real yields likely pushed some traders to reduce risk in gold. This looked more like a short-term reset than a real shift in the macro picture.
4. Positioning had become crowded
Gold had turned into a popular trade: long gold, short the dollar, long real assets. When too many people are on the same side, pullbacks tend to be quick and sharp rather than slow and controlled.
Market Structure & Trend
Daily Chart
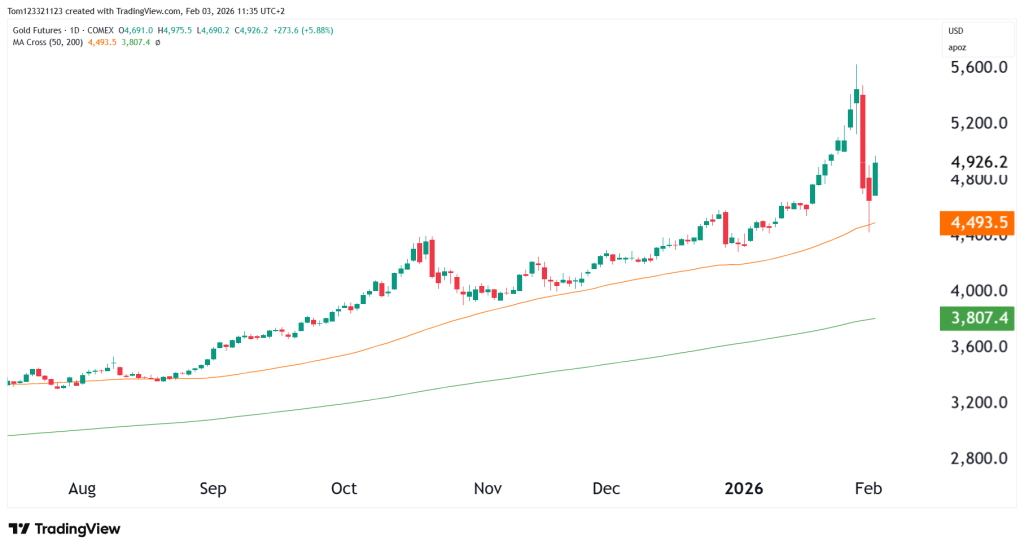
On the daily chart, gold has pulled back hard from recent highs, but it’s still holding comfortably above its rising 50-day moving average, which sits around the $4,450–4,500 area.
A few things stand out:
• The selloff stopped near rising trend support
• Buyers stepped in quickly after the initial drop
• Price did not stay below key trend levels
This looks like a correction inside a strong trend, not a breakdown. Even though volatility has picked up, the overall structure stays bullish as long as pullbacks remain above the 50-day average.
Key Technical Levels
Line in the sand
$4,450–4,500: This area lines up with the rising 50-day moving average and trend support. As long as gold stays above this zone, the broader bullish structure remains intact.
Levels that shape the bias
$4,900–5,000: This is the prior breakout area and an important psychological level. Getting back above it and holding would signal that upside momentum is returning.
Reference and extension levels
$5,300–5,500: Potential upside area if gold moves back into price discovery.
$4,200–4,300: Deeper support if volatility continues and the pullback extends.
Looking Forward: Scenarios
Bullish Continuation (45%)
Gold holds above $4,500 and reclaims $5,000, resuming price discovery toward $5,300+.
Volatile Consolidation (35%)
Price chops between $4,500 and $5,000 as momentum resets before the next directional move.
Deeper Correction (20%)
A break below the 50-day MA opens a pullback toward $4,200–4,300 while keeping the longer-term uptrend intact.
Final Takeaway
Gold dropped because the move got stretched too far, too fast.
Sharp pullbacks are normal in strong bull markets. They’re not a sign that the trend is broken. As long as gold holds above key trend levels, the bigger breakout stays intact. In fact, this kind of volatility can help strengthen the move by flushing out weak hands.
The real question now isn’t whether gold is still bullish. It’s how much time and consolidation are needed before the next push higher.
This analysis is for educational and informational purposes only and does not constitute trading advice or a recommendation to buy or sell any futures contracts. Futures trading involves significant risk and may not be suitable for all investors. Always conduct your own research and consult with a licensed financial professional before making trading decisions.