- Technical Analysis: The daily chart shows an ascending triangle pattern, indicating a bullish bias in the market.
- Capitulation Signal: A high volume spike at a specific low suggests a period of maximum pain, known as capitulation.
- Point of Control and Resistance: The volume profile’s point of control is at 130’02, potentially creating resistance as the market moves higher.
A fresh look at the technicals
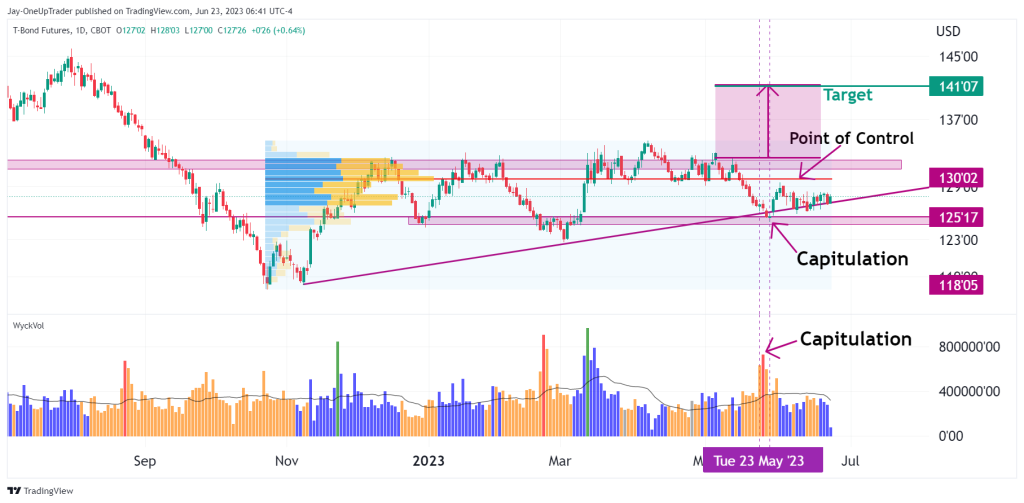
Ascending Triangle: There is an ascending triangle on the daily chart. This tells us that the market is forming a bullish bias. Price is currently testing the diagonal support line at 127’27.
Capitulation Candle: There was a capitulation with a high volume spike at the low I pointed to on the chart below. This signals that the low is temporary because it is a period of max pain. The buyers absorb the selling pressure, and the market rallies from there in more cases than not.
Point of Control: The volume profile point of control is at 130’02, which may cause some resistance as the market moves higher. There is also a smaller resistance zone above that which the bulls will need to push above for the market to rally higher.
Target if ascending triangle breaks to the upside: We can extend targets to 141’07, which is the measurement of the ascending triangle.