


Introduction
Light Crude Oil Futures (CL) have moved sharply higher from long-term support, climbing back above the $62 level. This move breaks price out of the lower trading range that had held crude oil prices in place for several months. After repeatedly finding buyers in the mid-$50s, WTI crude oil futures are now showing early signs that the market is starting to repair itself.
While it’s still too soon to call this a full trend reversal, the recent price action marks an important change in behavior. The oil market appears to be shifting away from simple stabilization and toward a more constructive recovery. If this strength continues, it could signal improving momentum in energy prices and a more supportive near-term crude oil outlook.
Market Summary

Primary trend: Still corrective on a longer-term basis, but showing clear signs of improvement as crude oil prices stabilize and attempt to build a base.
Current market regime: A range breakout with early signs of trend repair, suggesting that oil futures may be transitioning from consolidation into a recovery phase.
Key support (line in the sand): The $55–56 area remains critical. Holding above this zone keeps the constructive crude oil outlook intact.
Bias-defining level: Sustained acceptance above $62–63 would confirm the breakout and strengthen the bullish case for WTI crude oil futures.
Risk to the thesis: A move back below the reclaimed range highs would weaken the breakout and raise the risk of a return to range-bound or lower prices.
Why This Matters Right Now
Crude oil is starting to turn higher at an interesting moment across markets. Stocks are hovering near record highs, gold is breaking into new territory, and the U.S. dollar is stuck moving sideways. None of these markets look stressed, but they are all at levels where direction matters.
Historically, when oil stops falling and begins to stabilize after a long decline, it often signals that growth fears are easing or that macro risks are no longer getting worse.
Market Structure & Trend
Daily chart
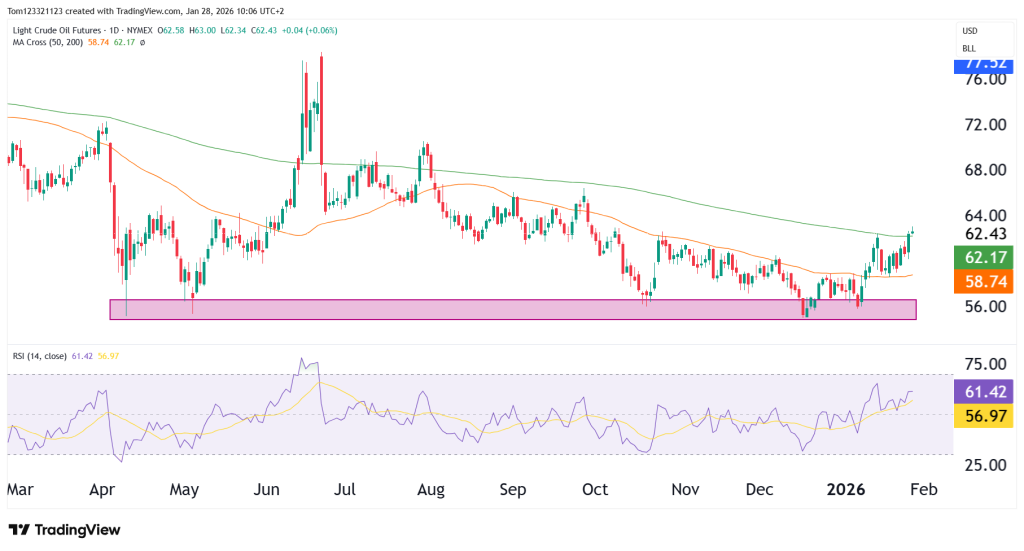
On the daily chart, crude oil clearly held the $55–56 support area, where buyers stepped in and stopped the decline. Since then, price has been making higher lows and has pushed through short-term resistance, showing that momentum is improving.
Price has also moved back above the 50-day moving average and is now testing the 200-day moving average around $62–63. This level matters. Holding above it would mark a real improvement in the medium-term trend, shifting crude out of a bearish range and into a more neutral, healthier setup.
So far, price is leaning into this level rather than getting pushed away, which is a positive sign. Pullbacks since the breakout have been small, suggesting sellers are backing off and no longer in control.
Weekly chart
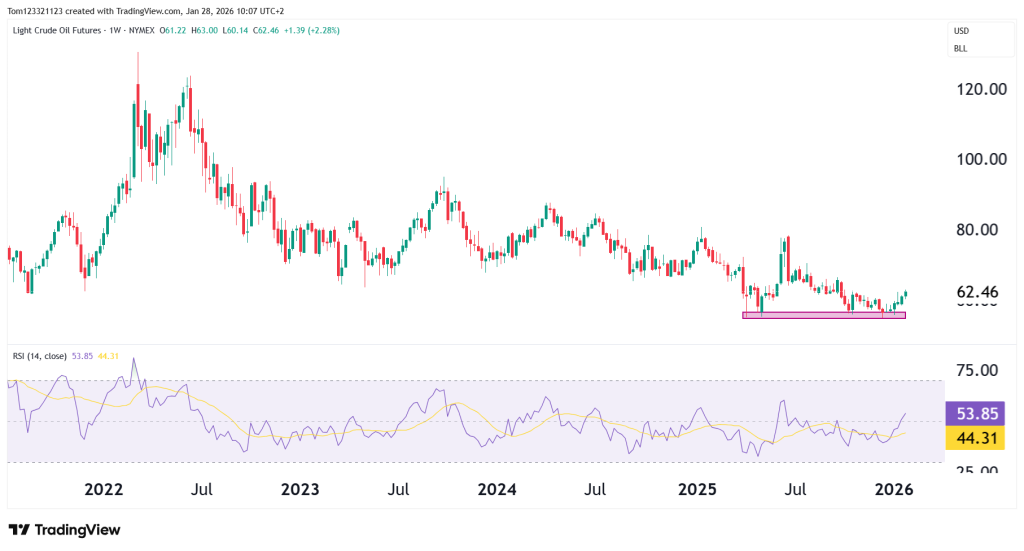
Looking at the bigger picture, crude oil appears to be building a base. On the weekly chart, price is holding above a clear support area that has been tested several times and continues to hold.
Momentum is also starting to improve. Weekly RSI has turned higher from low levels, which suggests that selling pressure has likely run its course.
This doesn’t confirm a new bull market yet, but it does support the idea that the worst of the downside may be behind us and that the market is in a healthier position than it was before.
Key Technical Levels
Line in the Sand
- $55–56: This is the key support area. If price falls back below this zone, the base breaks down and downside risk opens back up.
Bias-Defining Levels
- $62–63: This is the most important area right now. It lines up with the 200-day moving average and prior resistance. Holding and building above it would signal real progress in repairing the trend.
- $58–59: A former resistance area that has now turned into support. Holding here keeps the recent breakout intact.
Extension / Reference Levels
- $67–68: The top of the prior range and the next major area where sellers may show up.
- $72 and higher: A bullish extension level if crude is able to develop a sustained uptrend.
If you want this tighter, more conversational, or formatted for a trading plan or newsletter section, I can tweak it.
Looking Forward: Scenarios
Bullish Repair (40%)
Acceptance above $62–63 leads to a grind higher toward $67–68 as structure continues to improve.
Sideways Consolidation (35%)
Price holds between $58 and $63, digesting gains before the next directional move.
Bearish Failure (25%)
A rejection at the 200-day MA followed by a loss of $58 reopens downside risk toward $55.
This analysis is for educational and informational purposes only and does not constitute trading advice or a recommendation to buy or sell any futures contracts. Futures trading involves significant risk and may not be suitable for all investors. Always conduct your own research and consult with a licensed financial professional before making trading decisions.
