

Inarguably, support and resistance levels are the cornerstones of most price action trading strategies. And with pivot points, you can easily set the support and resistance levels on any timeframe. The pivot points’ support and resistance levels are static, designed to predict potential turning points within the trend. This makes them invaluable for determining optimal entries for breakout or reversal trading and setting stop loss and profit targets.
And given that pivot points can be set on any timeframe, pivot points trading strategies are ideal for scalping, day trading, swing trading, and position trading. These are the four pivot points trading strategies we’ll explain in this guide.
What are Pivot Points?
Pivot points are price levels on a chart showing an asset’s overall trend and its support and resistance levels on various timeframes. These support and resistance levels are based on a single point – the pivot point. The pivot point is the average of the preceding candle’s high, low, and close. With the pivot point as the reference price, the support levels are below it (labeled S1, S2, S3 …), and resistance levels are projected above it (labeled R1, R2, R3 …).
Depending on your settings, pivot points should ideally give at least three support and resistance levels. And the price action relative to the central pivot point helps determine whether the trend is bullish or bearish. When an asset is trading above the pivot point, the current trend is regarded as bullish, and when below the pivot point, the trend is bearish.
How to Calculate Pivot Points
This is just an overview of how the pivot points are calculated. There are five types of pivot points – standard, Fibonacci, Woodie’s, Camarilla, and Demark pivot points. While they have different calculations, you need not be concerned since the trading platform automatically calculates it.
As we mentioned, the first step in determining the actual pivot is the average of the previous candle’s high, low, and close.
Pivot Point = Previous candle’s (High + Low + Close) / 3
The successive support and resistance levels are determined relative to this pivot point.
- Resistance Level 1 (R1) = (Pivot x 2) – Previous candle’s Low
- Support Level 1 (S1) = (Pivot x 2) – Previous candle’s High
- Resistance Level 2 (R2) = pivot + (resistance level 1 – support level 1)
- Support Level 2 (S2) = pivot – (resistance level 1 – support level 1)
- Resistance Level 3 (R3) = Previous Day High + 2(Pivot – Previous candle’s Low)
- Support Level 3 (S3) = Previous candles Low – 2(Previous candle’s High – Pivot)
Pivot Points vs Fibonacci Retracements
At a glance, pivot points and Fibonacci retracements may seem similar – they both show an asset’s support and resistance. But as we’ve seen, pivot points create static support and resistance levels, while Fibonacci retracements can show price action’s dynamic support and resistance levels. Usually, Fibonacci retracements or extensions are created by connecting any two high and low-price points on a chart. And you can choose these points arbitrarily.
Although the calculation of the Fibonacci pivot point is similar to that of the standard pivot point, it utilizes Fibonacci retracement percentages to determine support and resistance levels.
How to Use Pivot Points
In any pivot points trading strategy, getting the most out of the pivot points is as simple as knowing how to utilize support and resistance levels. These are the most common uses of pivot points:
Determining Market Trends
You can use pivot points to identify whether an asset’s price action is bullish or bearish. When the price trends above the pivot point, it’s considered bullish and bearish when it drops below the pivot point. Two more things to note here. Firstly, when the pivot points are closer, it indicates that the market is possibly in a consolidation phase. And secondly, when the pivot points are far apart, the market is trending. It’s recommended to trade with the latter.
Identifying Optimal Entry and Exit Points
In pivot points trading, the support and resistance levels are invaluable in trade planning. They are used to anticipate potential price action reversals or breakouts. You can set your pending orders around these support and resistance levels. And since they take the prevailing volatility into account, you can use them to set optimal stop loss and profit targets.
You can use the subsequent support and resistance levels as profit targets too. This involves using partial profit targets to allow the market to reach deeper support or resistance levels. For example, when you buy an asset, you could close 50% of the position at R1, 25% at R2, and 25% at R3. And when you use this strategy, always remember to adjust your stop loss to the break-even level.
Pivot Points Trading Strategies
Pivot points remain static throughout the day, which is handy when planning trades in advance. As we mentioned, pivot points can be calculated for any timeframe – short-term, intermediate, and long-term, depending on your preferred trading style. Due to their versatility, pivot points can be used in scalping, day trading, swing, and position trading. And this leads us to our four pivot points trading strategies.
Day Trading Pivot Points Trading Strategy
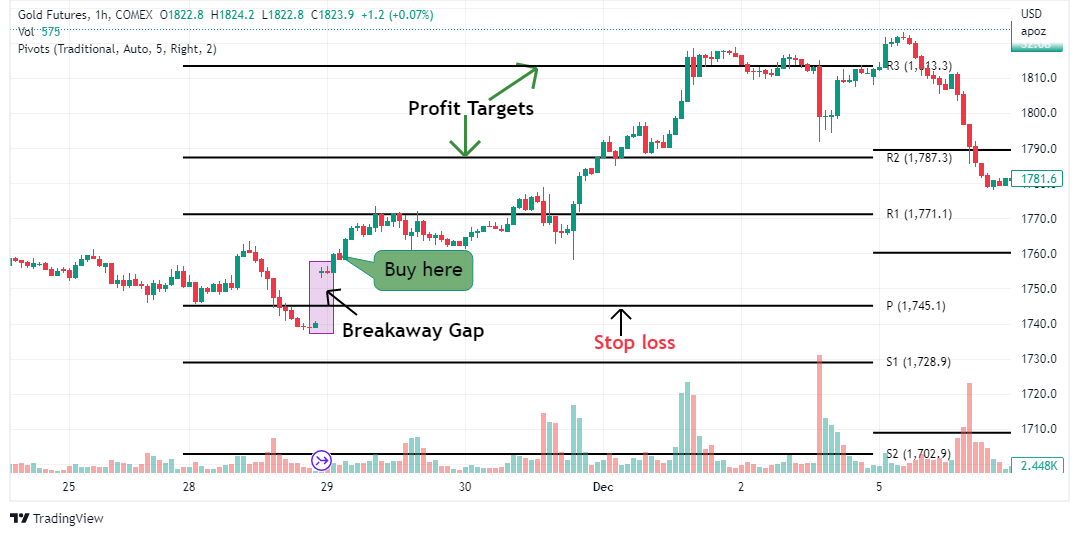
In day trading, you should consider using pivot points in conjunction with price gaps and candlestick or chart patterns. For example, let’s say that at the beginning of a session, the asset has an exhaustion gap with a reversal or continuation candlestick or chart pattern around a pivot point. In this case, you buy or short the asset, with your target around the central pivot point.
Here’s an example with a breakaway gap. In such a scenario, you open a long position with the target price around R2 and stop loss at the main pivot level.
Note that a combination of gaps and candlestick or chart patterns is rare. In their absence, you could always trade pivot points reversals or breakouts.
Scalping Pivot Points Trading Strategy
When scalping, the first objective is to identify the dominant trend on smaller timeframes – usually five to 15-minute timeframes. You could consider using trend indicators to establish this. Note that candlestick and chart patterns will also play a significant role in your scalping-pivot-points trading strategies. Here, your strategy is more or less similar to day trading, but given the rapid nature of scalping, price gaps rarely factor in.
Swing and Position Trading Pivot Points Trading Strategy
In swing and position trading, pivot points are set on higher timeframes, usually daily and weekly charts. For such longer-term trading, following the trend is recommended. That means the pivot points trading strategy offers better signals for breakout trading and trend reversals after the price action has bottomed or topped out. And just as in scalping, gaps rarely factor into pivot points trading strategy for swing and position traders.
Trading with pivot points
At first glance, pivot points can seem messy. But they can be pretty simple to interpret and implement in your pivot points trading strategies. Psychologically, pivot points trading strategies have a self-fulfilling prophecy. And this forms the basis of breakout and reversal pivot points trading. Regardless of the pivot points trading strategy you choose, it will involve pivot points breakout or reversal.
Pivot Points Breakout Trading
In the pivot points breakout trading strategy, you simply trade when the price action breaks above or below the main pivot point. Most traders’ instincts would be to buy immediately after the price reaches the resistance or short when it reaches the support. This is premature. Ideally, you should wait until these levels are breached.
Pivot Points Trading Bullish Breakout
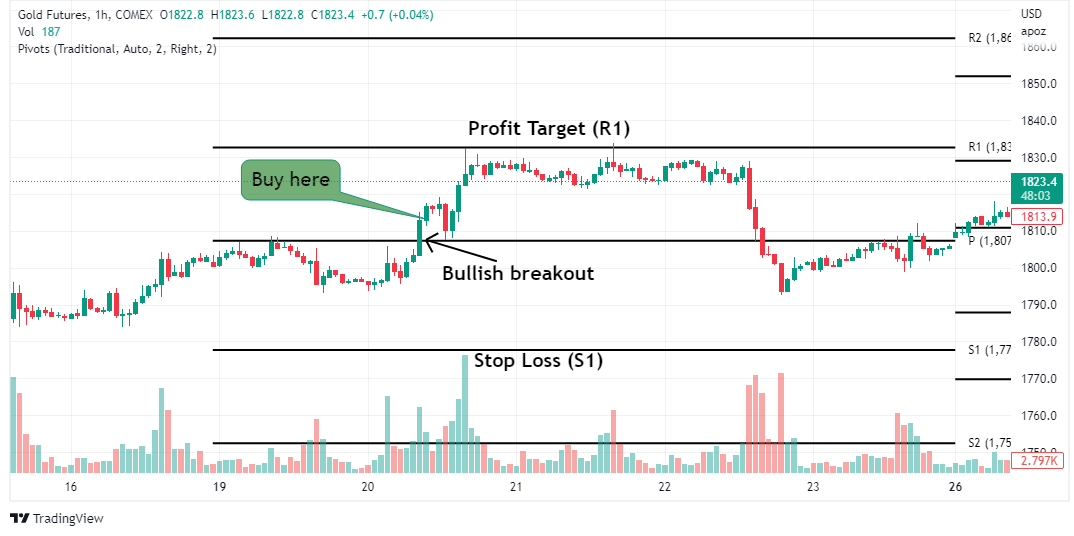
A bullish breakout occurs when the price action breaks above the central pivot point. In this case, go long only when the breakout candle closes above the pivot level, and the subsequent candle opens above it.
Your profit targets around the first resistance level (R1) because there’s a higher probability of the price hitting R1 than R2 or R3. And depending on your risk profile, you can set the stop loss just below the pivot level or near the S1. If the price continues to rise above R1, your next profit target is R2; if it breaks above R2, then R3 is your next target, and so on.
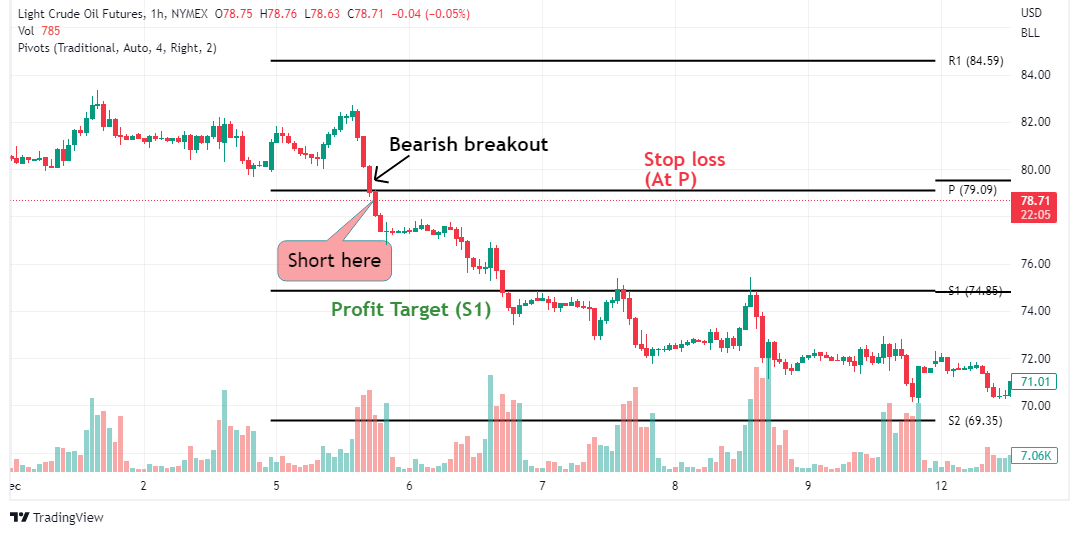
Pivot Points Trading Bearish Breakout
A bearish breakout occurs when the price action drops below the pivot level. Open a short position only when the bearish breakout candle closes below the pivot level, and the subsequent one opens below it.
Your profit target should be around S1, and the stop loss just above the pivot level or around R1, depending on your risk appetite. If the price drops below S1, S2 should be your next profit target, and if it drops below S2, S3 is the next target.
Pivot Points Reversal Strategy
This pivot points trading strategy is used when an asset’s price fails to breach the pivot level. In this case, you should enter a trade in the direction of the pullback. One of the best ways to trade reversals with pivot points is by combining candlestick patterns such as double tops and bottoms and triple tops and bottoms. This applies to both reversals and temporary pullbacks.
Pivot Points Bullish Reversal
A bullish reversal occurs when the price bounces off the main pivot level in a downtrend. Open a long position at the high of the previous candle. In this case, your stop loss should be below the pivot level, with your profit target around the immediate resistance level.
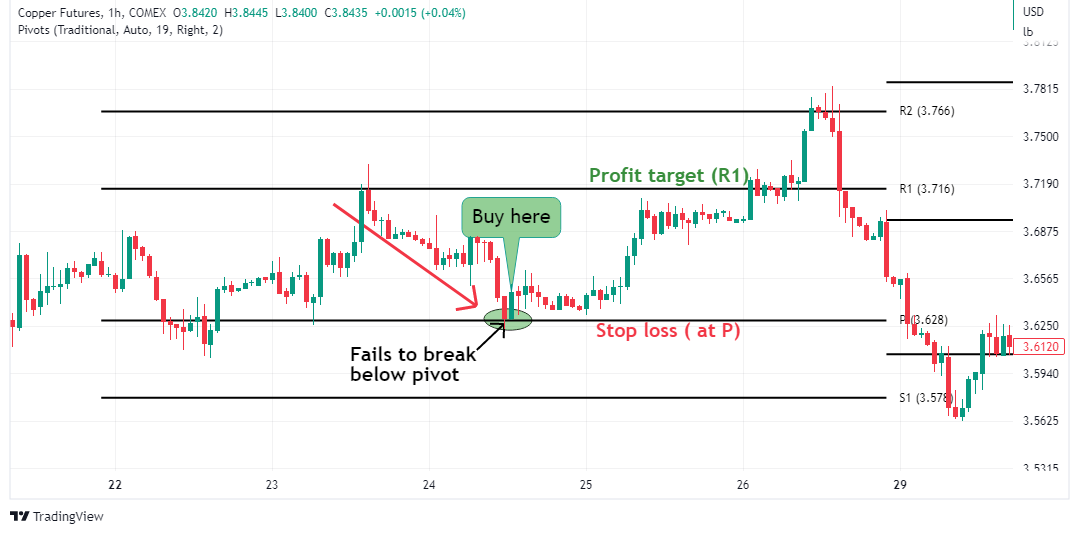
Pivot Points Bearish Reversal
A bearish reversal occurs when the price action fails to break above the pivot level in an uptrend. In this case, short the market below the previous candle’s low. Your stop loss should be above the pivot level and the profit target around the immediate support level.

The Bottom Line
As we’ve seen throughout this guide, pivot points are designed to anticipate significant turning points in the market. And this makes them ideal for determining the optimal entry and exit points. With pivot points trading, the general trend is considered bullish if the price action breaks above the pivot level and bearish if it drops below it. And this makes them ideal for breakout and reversal trading.

