


Introduction
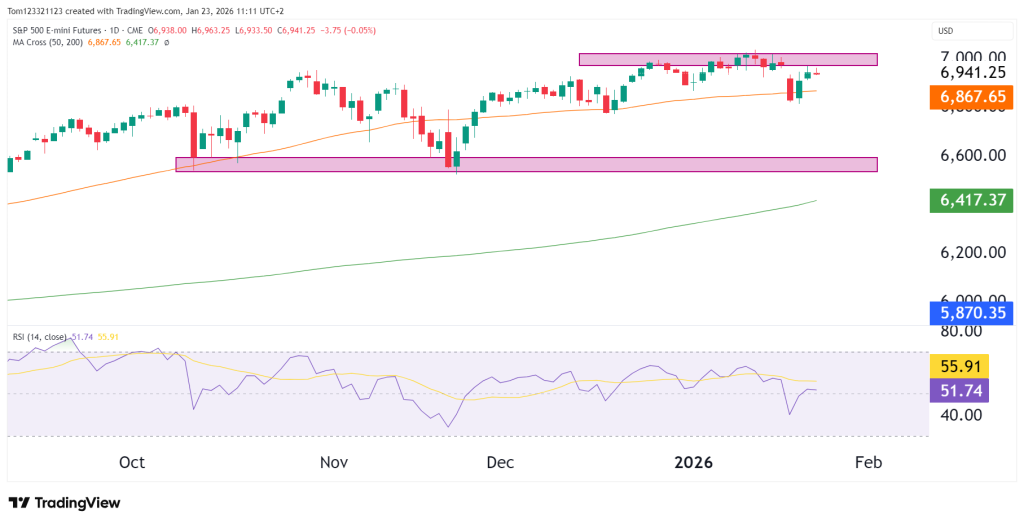
The S&P 500 E-mini Futures (ES) continue to trade just below the 7,000 handle, consolidating after an extended rally that has been persisting since April. Price remains near all-time highs, but recent action shows an intensifying battle between bulls and bears as buyers become more selective about the prices they pay.
Summary
Primary trend: Bullish
Current sentiment: Consolidation
Line in the sand: 6,850
Bias-defining level: 7,000 acceptance or rejection
Risk to thesis: Failure to hold 6,800–6,850 support
Why This Matters Right Now
ES is consolidating at record levels while other macro assets send mixed signals:
- Gold is in price discovery
- Crude oil is stabilizing at long-term support
- The dollar remains range-bound
Market Structure & Trend
Daily chart
On the daily chart, the 50 SMA has mostly held a line of support for price as buyers step in each time and send the market higher. The further below the 50 SMA that price falls, the more the buyers step in. From here, price is consolidating after new all-time highs were formed a few days ago which is normal market behaviour after strong impulse moves.
Buyers will likely be looking for opportunities on red candles, and some profit taking will still come in on green candles. If the price remains above the 50 moving average, then the trend remains firmly in the hands of the bulls.
Key Technical Levels
Line in the Sand
- 6,850–6,800: Loss of this zone would materially increase downside risk and shift the short-term bias from consolidation to correction.
Bias-Defining Levels
- 7,000: Acceptance above this level opens the door for trend continuation and momentum expansion.
- 6,850–6,880: Ongoing defense here keeps the pullback corrective.
Extension / Reference Levels
- 7,050–7,100: Upside extension if price breaks and holds above ATHs.
- 6,600–6,650: Deeper weekly support if a larger pullback develops.
Momentum (RSI): What to Watch Next
Daily RSI is holding near the 50–52 zone, reflecting neutral-to-constructive momentum rather than strength or weakness.
Key read-through:
- As long as RSI holds above 40–45, pullbacks remain corrective within the trend.
- A sustained loss of 40 would be the first signal of a regime shift toward deeper downside.
- A push back above 60 would confirm renewed upside momentum.
This momentum profile aligns with consolidation, not breakdown.
Volatility & Trend Health
Volatility remains contained despite proximity to ATHs. There is no evidence yet of stress-driven selling or impulsive downside behavior. This supports the view that the market is digesting gains rather than distributing risk aggressively.
A volatility expansion would most likely occur after a resolution of the current range.
Looking Forward
Bullish Continuation (40%)
Holding above 7,000 leads to trend continuation toward 7,050–7,100 as momentum reaccelerates.
Sideways Consolidation (35%)
Price remains range-bound between 6,850 and 7,000, allowing time-based correction.
Deeper Pullback (25%)
A failure to hold 6,850 opens a move toward the 6,600–6,650 zone, still consistent with a higher-timeframe uptrend.
Bottom Line
ES is still in a clear long-term uptrend, but it’s now sitting in a tough area near all-time highs. At these levels, the market often needs time to pause and sort itself out. That’s what we’re seeing now: price is moving sideways and consolidating, not breaking down or showing signs of real weakness.
This kind of action usually means buyers and sellers are temporarily balanced. The market is digesting recent gains rather than starting a new downtrend. As long as price holds above key support levels, pullbacks should be viewed as normal corrections within a bullish trend, not as a major warning sign.
That said, patience is important here. Trading near record highs can lead to choppy, slower price action as the market works through this range. Waiting for clearer direction or cleaner setups may be wiser than forcing trades while ES decides its next move.
This analysis is for educational and informational purposes only and does not constitute trading advice or a recommendation to buy or sell any futures contracts. Futures trading involves significant risk and may not be suitable for all investors. Always conduct your own research and consult with a licensed financial professional before making trading decisions.
