- Topic: CL daily chart and OPEC output cut
- Analysis: 1-2-3 reversal pattern confirmed by OPEC announcement
- Trend: CL currently in a bullish trend
- Resistance: Price currently trading at a resistance level
- Breakout potential: Potential for break out trade toward $100
- Hourly chart: Possible entries on the hourly chart using Gaussian channel
- Long positions: Long bias could be questioned if channel turns red
Recap
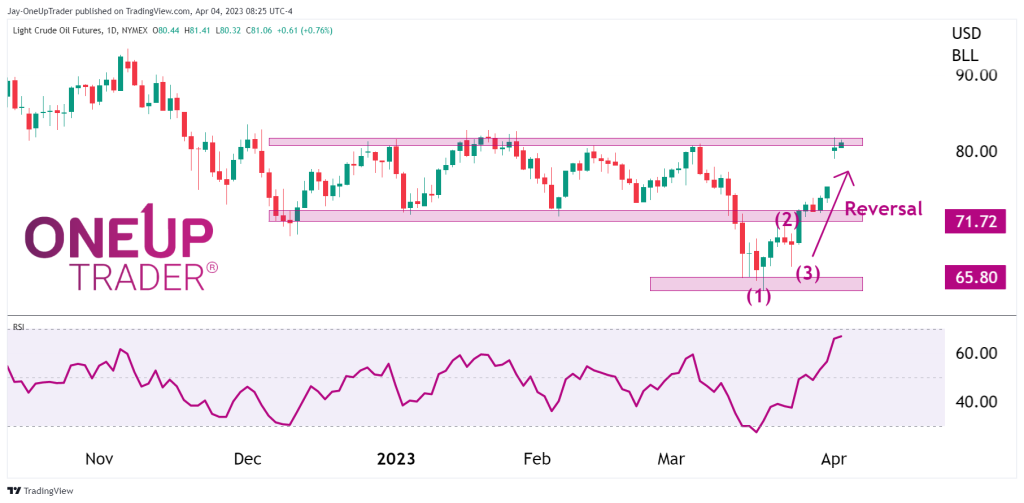
Last week we looked at the great example of the 1-2-3 reversal playing out on the CL daily chart. Opec announced an output cut shortly after the analysis, which assisted the price action of CL to further confirm the pattern.
Where to from here?
CL is in a bullish trend at the moment, but that does not mean we must chase the market higher. Price is currently trading at a resistance level which is likely to cause a halt in the price action for a few days. If traders are happy to wait it out, there could be a potential break-out trade toward $100 as it breaks above the range shown in the image below.
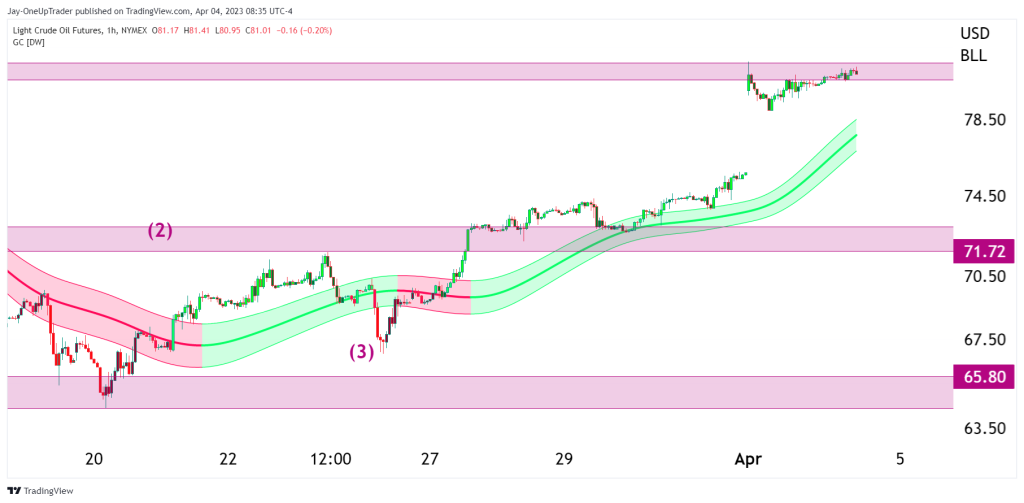
Possible entries
If we drop the time frame to the hourly chart and apply the gaussian channel, we could wait for pullbacks to the channel and begin initiating long positions. If we see the channel turn red, it indicates the trend is reversing, and the long bias we have formed will come into question.