


Introduction
Nasdaq-100 futures (NQ) are stabilizing after bouncing from a multi-week low near 24,300 earlier in November. The index has now reclaimed the 25,000 level and is trading just beneath a major resistance band that has capped every rally since late October. From here, bears could try to push the price back to the level of 24,200, and bulls will try to push the price back above the current resistance band.
Technical Overview
NQ Daily Chart
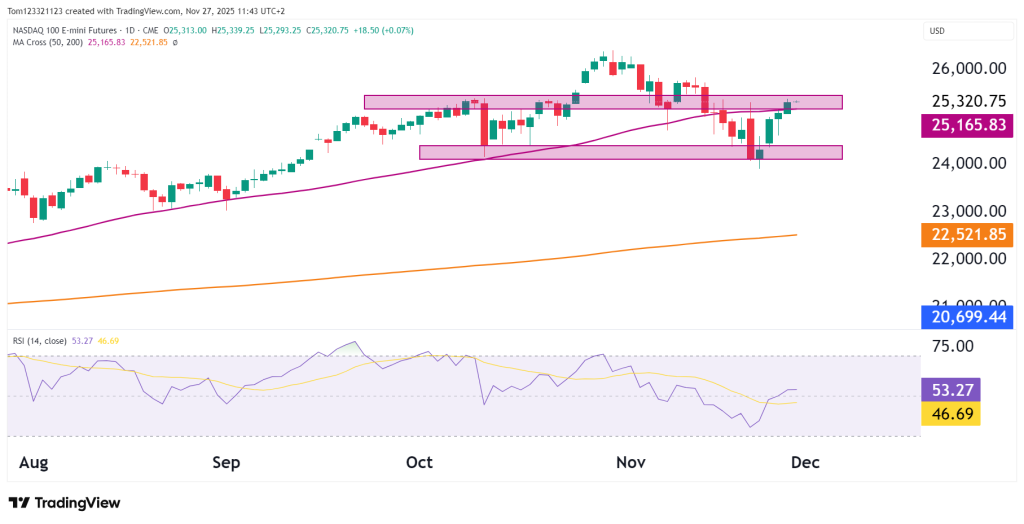
The recent rebound has pushed NQ back into the 25,150–25,350 resistance zone, an area that acted as both support and resistance multiple times over the past two months. This makes it an important zone to watch, a clean breakout above it would signal that buyers have regained control after November’s retracement.
Price is now trading slightly above the 50-day moving average (25,165.83), a positive shift but not yet confirmed by strong enough bullish price action. The 200-day moving average remains far below at 22,521.85, and in order for that to be tested, there would need to be a significant change in sentiment.
Key Levels in Focus
- Resistance Zone: 25,150–25,350
The biggest near-term resistance. A breakout here opens the door to retesting 25,800–26,000. - Secondary Resistance: 25,700–25,950
Recent swing highs. Bulls need a higher high to confirm trend continuation. - Support Zone: 24,300–24,550
This zone has held twice in November and now forms the major downside floor. - Trend Support: 50-day MA at 25,165
Price is sitting right on top of this area, and holding above it signals improving sentiment.
Market Structure Summary
NQ is shifting from a period of consolidation to a possible new bullish leg upward. Price action will need to break above the current levels in order to confirm this, however.
What to Watch Next
| Scenario | Estimated Probability | Notes |
|---|---|---|
| Bullish breakout above 25,350 → retest 25,800–26,000 | 45% | Improving momentum, price back above 50-day MA, buyers active off November lows. |
| Range-bound between 24,500–25,350 | 40% | Strong support at 24,300–24,550 and heavy resistance overhead make consolidation likely if bulls don’t follow through. |
| Pullback toward 24,400 → retest November lows | 15% | Would require a rejection at resistance and a drop back below 25,000. |
Summary
Nasdaq-100 futures are starting to recover, with price back above the 50-day moving average and approaching a major resistance between 25,150–25,350. Momentum is improving, but the market remains at an inflection point; buyers must break above resistance to confirm a renewed bullish trend. Until then, NQ remains range-bound with a positive bias.
This analysis is for educational and informational purposes only and does not constitute trading advice or a recommendation to buy or sell any futures contracts. Futures trading involves significant risk and may not be suitable for all investors. Always conduct your own research and consult with a licensed financial professional before making trading decisions.