As the Dollar continues to fall, eyes are on the Euro and how it will weigh up against the rest of the world currencies. In this week’s technical analysis, we take a look at the monthly, weekly, and daily charts. We also look for trade ideas and ways to play the market.
Monthly Chart
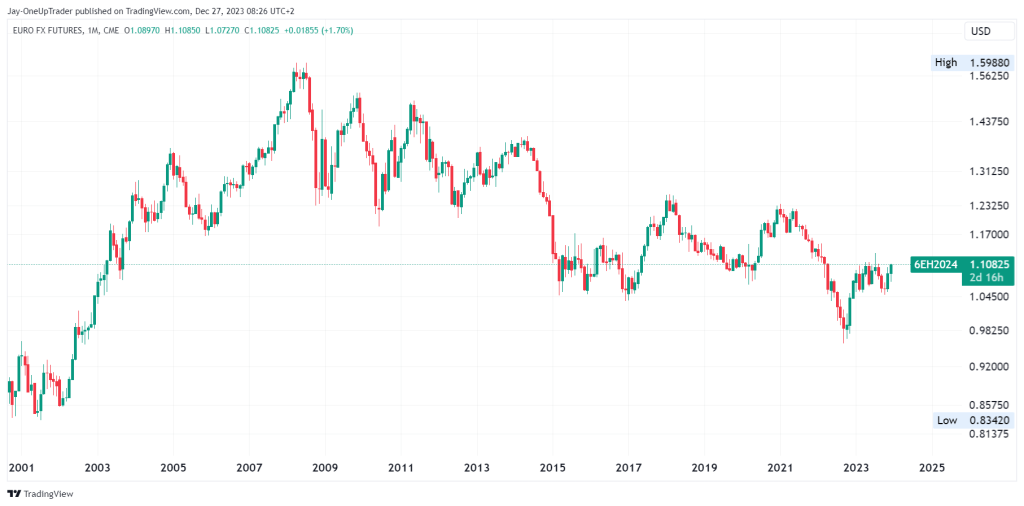
The monthly chart presents a broad view of the Euro FX’s price action over the past two decades. Notably, the market has experienced significant fluctuations in price, but a few long-term levels stand out.
Firstly, there’s a pivotal resistance zone around the 1.20 mark, which the market has tested multiple times. This level dates back to the early 2000s and has been a decisive turning point on several occasions. On the flip side, the 0.85 level has served as strong historical support. These are major long-term levels, and if price was going to test 0.85 again, we would likely wait years for that. The monthly close for December looks to be a bullish candlestick and after the small attempt to make new lows which is failing, we might see 6E move above 1.17 in the first quarter of next year.
Currently, the Euro is trading near the 1.10 level. Should the bulls begin to gain an edge, a sustained push above this area could lead to a retest of the 1.20 resistance.
Weekly Chart
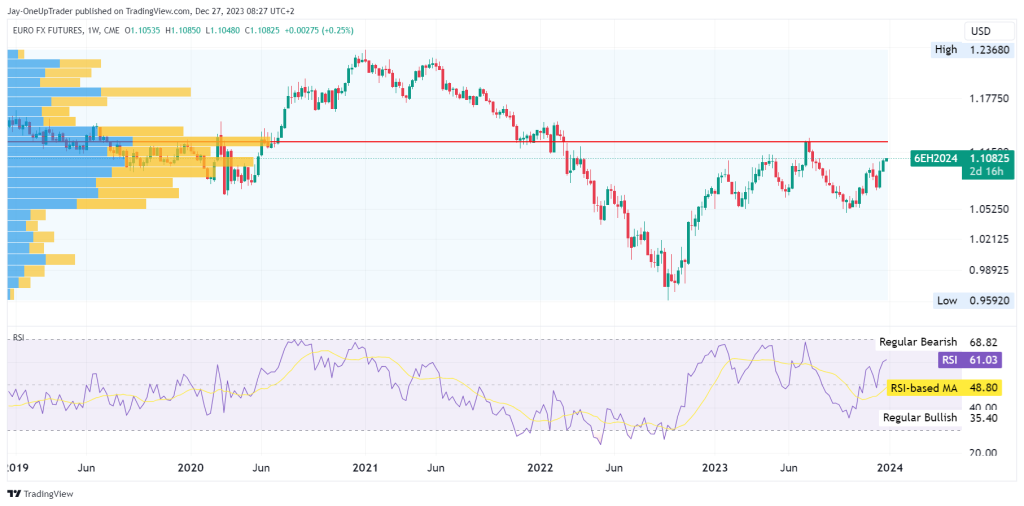
Switching to the weekly chart, we incorporate the volume profile to pinpoint areas of significant trading activity. The most substantial volume node, sitting around the 1.10 level, aligns with our current price, suggesting a consolidation phase. The market’s respect for this volume node indicates that a break above could lead to a swift move towards the next significant node near the 1.17 level. The volume profile on the left of the chart shows the low volume node between the current price and 1.17 which is what could accelerate the price quickly.
The Relative Strength Index (RSI) on the weekly timeframe is neutral with readings just above the 60 mark. Should the RSI continue to rise and cross into overbought, it would signal increasing bullish momentum, potentially validating a breakout above the current consolidation zone.
Daily Chart: Short-Term Trade Setups
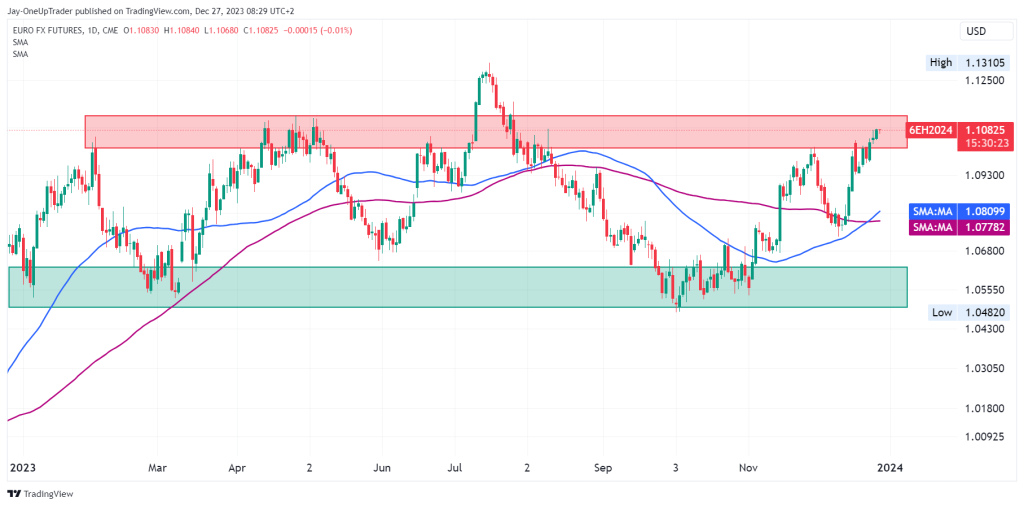
On the daily timeframe, the 50-day SMA and the 200-day SMA are converging near the 1.08 mark, a bullish indicator if the price remains above these averages. Currently, the market is testing a resistance area at approximately 1.10, which, if broken, could open a path toward the 1.13 level, a recent high.
Given the current positioning above the SMAs and the recent upward trend, a long trade could be considered on a decisive daily candle close above the 1.10 resistance. Stop losses could be placed below the SMAs to protect against any sudden reversals.
Conclusion: Probable Scenarios and Market Sentiment
The monthly and weekly charts suggest a bullish outlook if the market sustains above key levels. Traders should watch for a clear break above 1.10 on the daily chart for long entries, with 1.13 and 1.17 as subsequent targets. Conversely, a reversal below the SMAs might shift the sentiment to bearish, targeting the 1.05 support.
Remember, while the technicals provide a roadmap, external economic factors and market sentiment can swiftly change the trajectory. Trade your plan and always manage risk appropriately.