


Overview
Crude oil has seen a sharp unwind following last week’s geopolitical-driven spike above $77. Over the past 48 hours, a de-escalation in tensions between Iran and Israel has cooled risk sentiment, pushing prices back into the prior breakout zone between $64 and $68.
A rapid +20% rally driven by fear premiums has now corrected nearly in full, reinforcing that this remains a headline-sensitive market where sustainable trend direction must align with both technical and macro flows.
Technical Breakdown
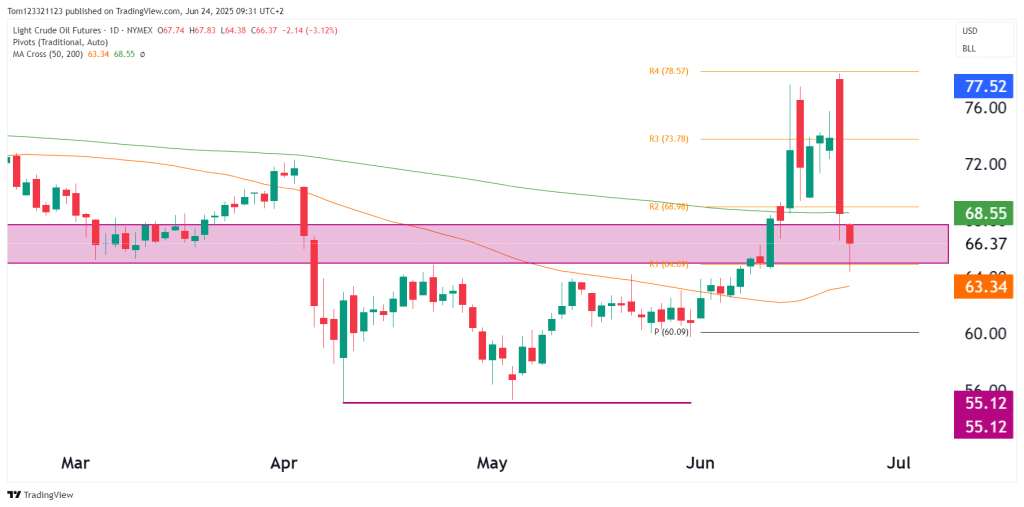
Daily Chart (1D):
- Key Support Zone: $64–68 (former resistance flipped support).
- Major Drop Candle: Friday’s rejection at $77.50 (R4 pivot) produced a decisive bearish engulfing pattern.
- Moving Averages:
- 50-day MA: $63.34 (holding just above it)
- 200-day MA: $68.55 (being retested from below today)
- Trend: Broken short-term bullish structure with a lower high now in place.
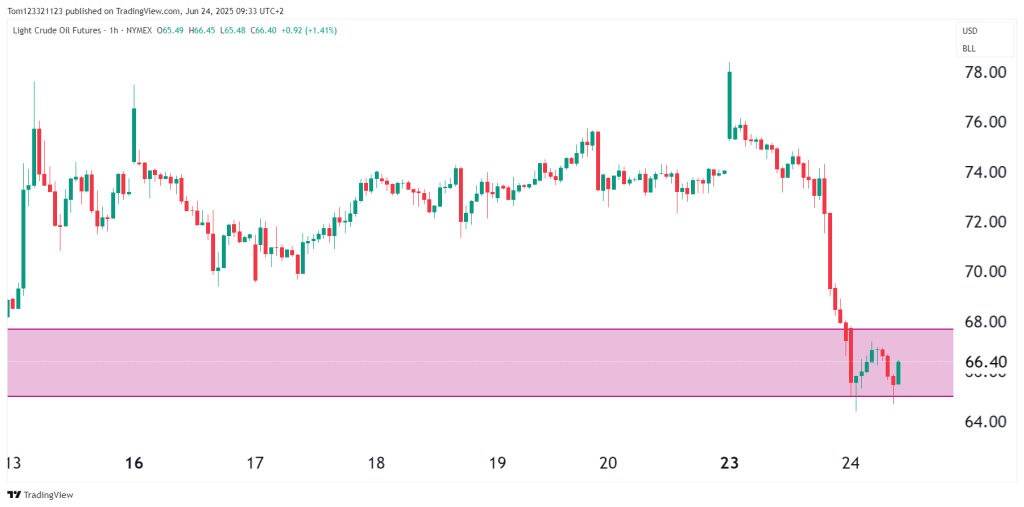
Hourly Chart (1H):
- Price dropped over $10 in 48 hours.
- Current bounce off $65 aligns with the lower boundary of the daily support block.
- Initial rejection around $67.30 this morning suggests intraday bears are fading rallies aggressively.
- RSI (H1): Beginning to recover from oversold – potential for short-term relief bounce.
Scenario Probability Table
| Scenario | Description | Probability | Comment |
|---|---|---|---|
| Neutral Consolidation (64–68) | Price oscillates in the prior breakout zone; volatility cools | 50% +/- | Most likely; market digesting risk unwind |
| Bounce toward $70–72 | Short-covering rally after oversold reset; hourly bullish structure rebuilds | 30% +/- | Likely only if no bearish headline re-emerges |
| Breakdown below $64 | Newsflow turns bearish or macro weakness drives energy lower | 20% +/- | Would target $61–60 area fast, invalidating bullish case |
Trade Setups & Strategy
| Type | Entry Zone | Stop-Loss | Target(s) | Rationale |
|---|---|---|---|---|
| Range Play | Long $64.50–66.00 | Below $63.30 | $68.00 / $70.00 | Buy the demand zone with defined invalidation level |
| Fade Rebounds | Short $67.50–68.00 | Above $69.30 | $65.00 / $64.00 | If price struggles to reclaim 200DMA ($68.50), fade rallies |
| Breakout Trade | Long above $69.00 | Below $67.20 | $72.00 / $74.00 | Momentum setup if price reclaims upper resistance band |
Macro & Geopolitical Context:
- Iran–Israel De-escalation: Reports point to reduced military activity and back-channel diplomacy, particularly through Turkish and Russian mediation.
- OPEC+ Comments: So far muted; no emergency meeting called — traders should watch for surprise statements.
- U.S. Inventories & Summer Demand: API and EIA data this week will determine if macro demand validates recent pricing.
Final Take:
While the $77 blow-off top has capped the upside for now, price has landed back into a technically valid support zone. Unless new conflict escalation headlines reignite the bid, CL may range between $64–68 for several sessions. Swing traders should focus on this zone with tight stops, while scalpers can work intraday reversion setups on the hourly chart.


