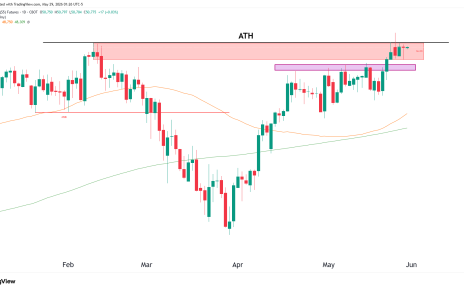
ES (S&P 500 Futures) is currently trading near its all-time highs (ATH at 6,166.50), with strong weekly candles and bullish momentum.
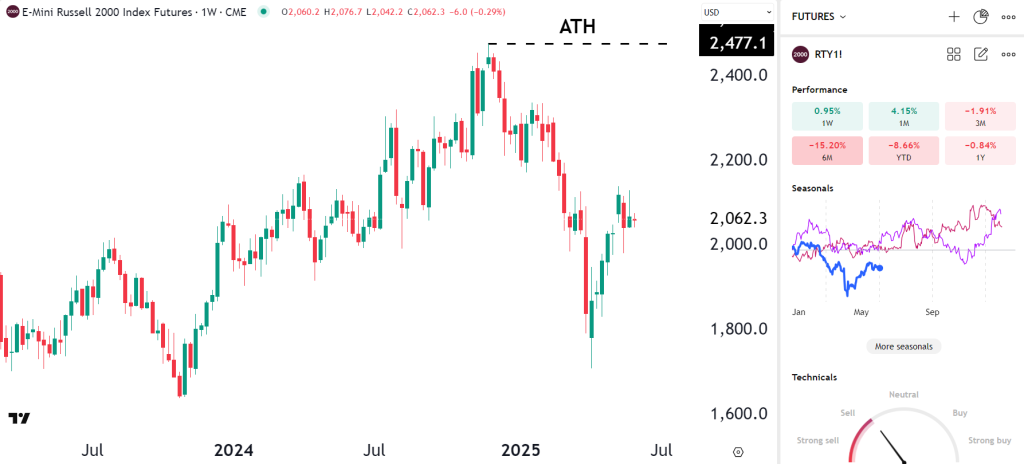
RTY (Russell 2000 Futures), however, is still trading ~17% below its ATH of 2,477.10, with price currently near 2,062.
6-month performance comparison
ES:-2.76% (recovering rapidly)
RTY:-15.20% (still in drawdown)
The YTD performance remains negative for both, but RTY is worse:
ES:-0.37%
RTY:-8.66%
Weekly Chart of RTY: Structure and Trend
Bullish Observations:
RTY posted a sharp rally off the April lows near 1,800.
Recent candles show stabilization, but momentum is waning as price struggles near the 2,060–2,100 area.
Caution:
No clear breakout above weekly resistance (~2,100–2,120).
Weekly trend is still lower highs, lower lows, unless RTY closes decisively above 2,200.
Compared to ES, which is in breakout formation, RTY remains a sideways laggard.
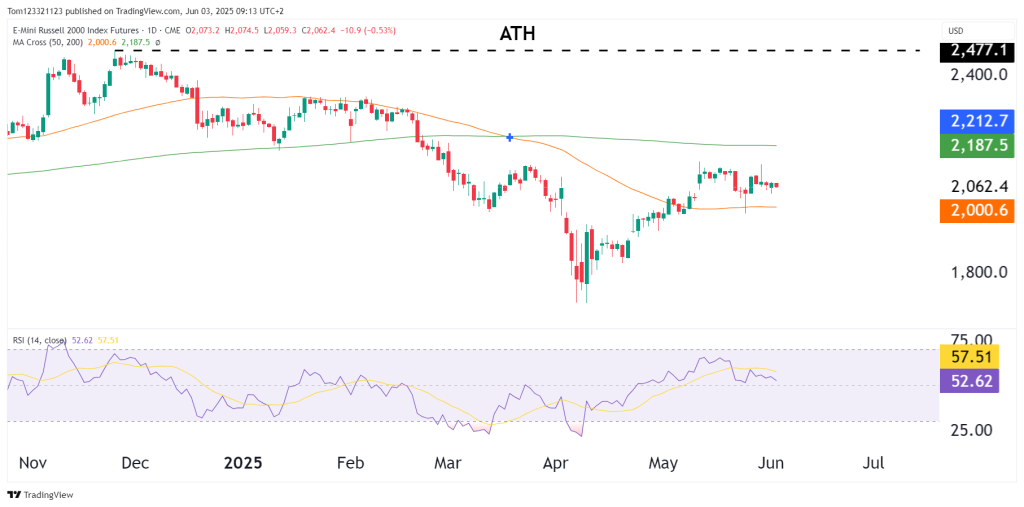
Daily Chart of RTY
Moving Averages
50-day MA (orange): 2,000.6 → acting as short-term support
200-day MA (green): 2,187.5 → strong resistance ceiling
Price is now trapped between the two MAs.
RSI (14)
RSI at 52.62, still in neutral territory.
Momentum is fading, with RSI pulling back from recent peaks near 65.
Divergence developing: price remains range-bound while momentum weakens.
Structure
Range-bound behavior between 2,040 and 2,100
No aggressive bullish follow-through since the rally off April lows
Compression forming with lower highs on daily, suggesting a potential decision point soon
Metric
ES (S&P 500 Futures)
RTY (Russell 2000 Futures)
Trend (Weekly)
Strong uptrend
Sideways, potential reversal
Proximity to ATH
~4% below ATH
~17% below ATH
Daily Trend
Bullish continuation
Range/consolidation
RSI Momentum (Daily)
Above 60 (bullish)
~52 (neutral)
50/200 MA Status
Above both
Between both
Key Levels for RTY
Support Levels
Resistance Levels
2,000.00 (50-day MA)
2,100.00 – near-term ceiling
1,950.00 (Range base)
2,187.50 (200-day MA)
1,800.00 (April low)
2,250.00+ = breakout confirmation
Ending Off
RTY remains the weakest link among U.S. equity indexes. While the S&P 500 is setting up for a potential ATH breakout, RTY is stalled in a neutral range. For RTY to catch up:
A decisive close above 2,200–2,220 is needed to shift the narrative to bullish rotation.
Otherwise, continued underperformance is likely as large-caps (ES) dominate flows.
The weekly chart shows a triple-top reversal pattern forming, with resistance around $2088. This is a pivotal zone – if price can break out above $2088 decisively, it would invalidate the bearish pattern and imply an upside breakout. However, failure to break resistance could confirm the pattern and precede a downward move. The weekly RSI Read More…
Introduction Dow Jones futures continue testing the record highs after successfully breaking above the previous all-time high earlier this week. In our last analysis, we highlighted the importance of the 50,900 level as buyers attempted to push into price discovery. Since then, YM has done that, but has not broken through with conviction. The current Read More…
Introduction NQ has staged a very aggressive V-shaped reversal, rallying from the ~23,000 lows back toward 26,500+, approaching the all-time high (~26,863). This is a big difference from a few weeks ago when NQ was sitting at a one-year low. Just recently, the market was breaking down, showing weakness and uncertainty. Now, it’s back within Read More…