

Price Structure & Technical Levels
- Support:
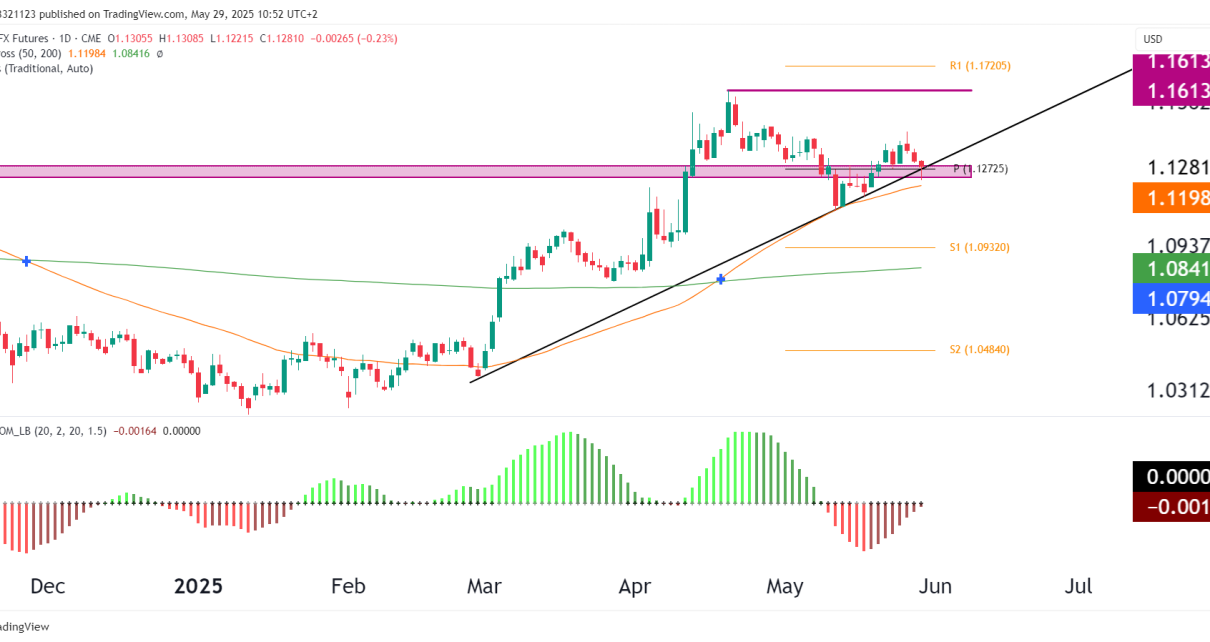
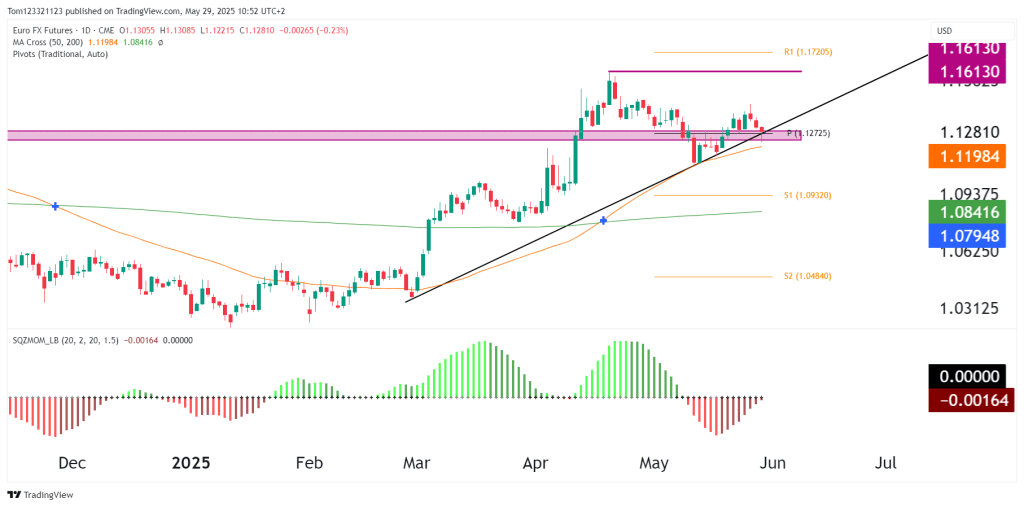
- Rising trendline from the March low remains respected.
- 50-day MA at 1.11984 is a key near-term support.
- 200-day MA at 1.08416 shows how strength has shifted bullish since the Dollar has sold off.
- Resistance:
- Horizontal supply at 1.12725–1.13050 remains a sticky zone.
- Breakout resistance at 1.16130 is the next major upside hurdle.
- Trend:
- Still in a bullish market structure with higher lows and higher highs.
- However, momentum is waning, and price is consolidating beneath the horizontal pivot level.
Momentum and Squeeze
- Squeeze Momentum
- Histogram has turned red and is slightly expanding lower, momentum to the upside is cooling.
- No “squeeze” is firing, but the compression suggests a move may be building.
Probabilities
| Timeframe | Bull Case | Bear Case | Probability |
|---|---|---|---|
| Short-Term (1–2 weeks) | Break above 1.1300 leads to quick test of 1.1450–1.1613 | Failure at 1.1300 leads to pullback to 1.1198 and possibly 1.1120 | Neutral-to-Slightly Bullish (55%) |
| Medium-Term (2–6 weeks) | Retest and hold of trendline, breakout toward 1.1720 | Breakdown below 1.1180 leads to a deeper retrace to 1.0930 | Still Bullish Bias (60%) |
| Long-Term (3+ months) | Dovish Fed + risk-on push EUR toward 1.20–1.21 | USD strength returns, euro fades back toward 1.08 | Balanced (50%) |
Ending Off
The Euro remains technically bullish, but momentum is stalling. Price action near 1.1275–1.1300 will be decisive, a clean break higher could trigger a fast extension to 1.16130, while rejection here would confirm this as a local top.
Key Trigger to Watch:
- A daily close above 1.1300 with rising volume would confirm a bullish continuation.
- A close below 1.1180 breaks the trendline and opens downside toward 1.0930.
Put Your Technical Analysis Skills To The Test At OneUp Trader Funded Trader Program!
