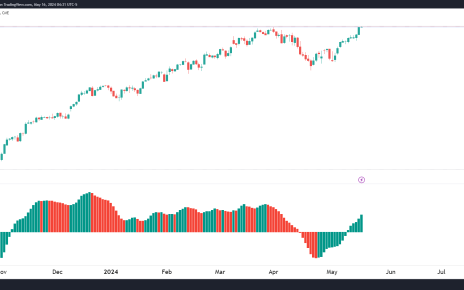
Introduction The S&P 500 Futures (ES) has rebounded from its recent 7% pullback and broke above the all-time high on May 15th. Technicals look bullish and follow a trend. We can begin grinding down to shorter time frames, avoid looking for shorts, and focus solely on looking for longs on our short-term strategies. Why Daily Read More…
Fed Minutes leave markets unchanged ES trading near the long-term trend line Pullback entries giving positive results on lower time frames Yesterday, August 17, the Fed released its meeting minutes which has left most indices unchanged for the most part. ES futures are approaching the upper trend line, which has held since the start of Read More…
The Daily chart shows signs of a rollover. Gaussian channel, candlestick, and Fibonacci analysis on the Daily chart. There is a potential Marg Simpson pattern on the 4-Hourly chart. Medium Term Outlook The Equity markets have enjoyed a rebound spurred on by the fall in the price of the Dollar. The three main aspects to Read More…


