

Introduction
The pin bar is one of the most powerful and widely-used candlestick patterns in technical analysis. Found in every market and on every timeframe, the pin bar can signal trend reversals, continuations, and breakouts.
But what exactly is a pin bar, how do you identify one, and most importantly, how do you trade it effectively? In this guide, we’ll cover everything you need to know to master the pin bar candlestick pattern and add more knowledge to your memory bank.
What is a Pin Bar Candle in Trading?
Definition of a Pin Bar
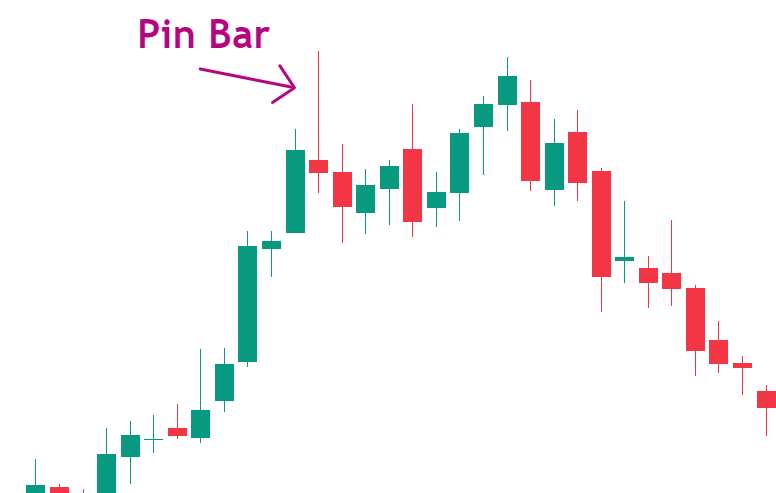
A pin bar, short for “Pinocchio bar,” is a single candlestick formation characterized by a long wick (or shadow) and a small real body. The body of the candle represents the open and close, while the wick shows the high and low of the period. For a candlestick to be considered a pin bar, the wick must be significantly longer than the body, typically at least 2-3 times the length.
Bullish vs Bearish Pin Bars
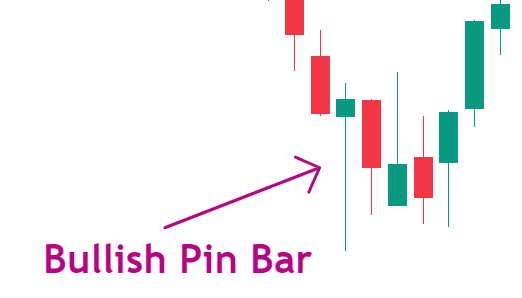
Pin bars can be either bullish or bearish, depending on where the long wick and real body are positioned. A bullish pin bar has a long lower wick and a small body in the upper part of the candle. This indicates that sellers tried to push the price lower but were overpowered by buyers, resulting in a close near the high.
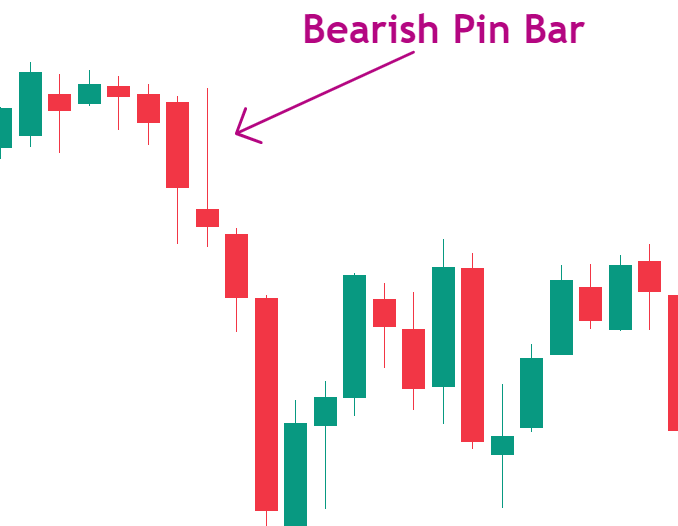
Conversely, a bearish pin bar has a long upper wick and a small body in the lower portion of the range. This shows that buyers attempted to drive the price up but were overwhelmed by sellers, leading to a close near the low.
Psychology Behind Pin Bars
The pin bar candlestick pattern provides a unique insight into market sentiment and psychology. The long wick represents a rejection of a price level, showing that the market tested a high or low but was unable to sustain the move. This implies that the opposing force (buyers in a bearish pin bar or sellers in a bullish pin bar) was stronger and forced prices to reverse.
This battle between buyers and sellers and the subsequent rejection of a level can signify a potential change in market sentiment. If a bearish pin bar forms after an extended move up, it could indicate that the uptrend is losing momentum and that sellers are starting to take control. Similarly, a bullish pin bar after a prolonged decline means that the downtrend is probably running out of steam and that buyers are ready to step in.
How to Identify Pin Bar Candlestick Patterns
Key Characteristics of a Pin Bar
To properly identify a pin bar, look for these essential characteristics:
- A long wick that is at least 2-3 times the length of the real body.
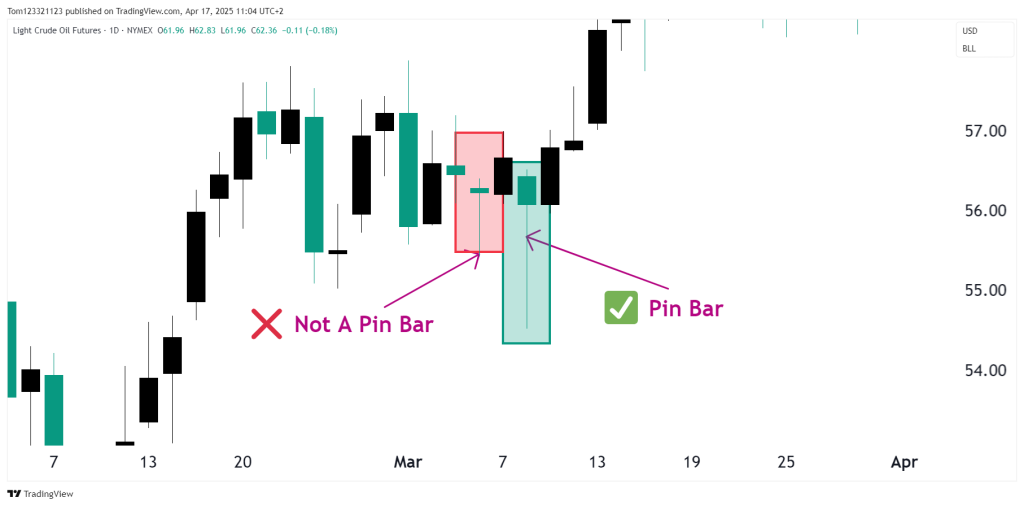
- The real body is located near one end of the candle, not in the middle.
- There is little to no wick on the opposite side of the long wick.
- The pin bar stands out from surrounding price action (e.g., it’s larger than nearby candles).
Pin Bars on Different Timeframes
Pin bars can form on any chart timeframe, from 1-minute to monthly. However, the significance and reliability of the pattern can vary depending on the timeframe used. Generally, pin bars on higher timeframes (4-hour, daily, weekly) are more reliable than those on lower timeframes (1-minute, 5-minute, 15-minute).
This is because each candle on a higher timeframe represents more price action and therefore carries more weight. A daily pin bar, for instance, shows rejection of a level over a full trading day, whereas a 5-minute pin bar only represents a five-minute battle. That said, lower timeframe pin bars can still be useful, particularly when they align with higher timeframe patterns or levels.
The lower you go in time frame, the more you are fighting against bots and algorithms, which make the price action inconsistent and difficult to read correctly. Generally, the higher time frames mean most candlestick patterns have a higher probability of playing out.
Pin Bars at Key Levels
Not all pin bars are created equal. The location and context of the pin bar can drastically affect its significance and reliability. The most meaningful pin bars form at key technical levels such as:
- Support and resistance zones
- Trend lines
- Moving averages (e.g., 20-day, 50-day, 200-day)
- Fibonacci retracements or extensions
- Chart pattern boundaries (e.g., head and shoulders, triangles, wedges)
- Overbought or Oversold coniditons.
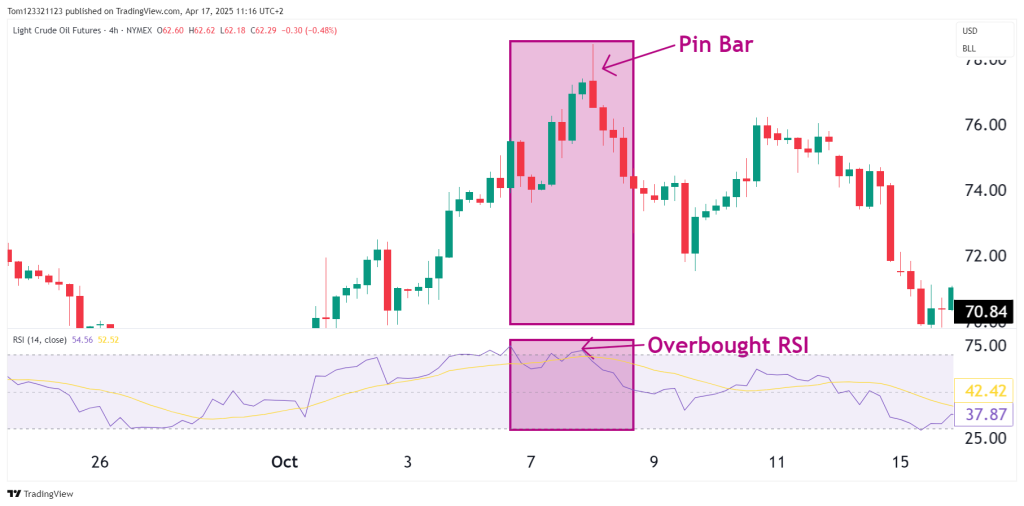
When a pin bar forms at one of these levels, it carries more weight because it shows a rejection of a significant price area. For example, if a bearish pin bar forms right when price has been trending upward with speed, and the RSI moves into overbought, it will have higher conviction than if it was in the middle of a range.
A pin bar that forms in the middle of a range or consolidation, with no notable technical levels nearby, is less likely to lead to a meaningful move. Always consider the bigger picture and surrounding market structure when evaluating a pin bar.
Bullish Pin Bar Candlestick Pattern
Identifying Bullish Pin Bars
While we’ve already discussed the basic structure of a pin bar, it’s important to understand the specific characteristics that define a bullish pin bar. These include:
- Location of the real body: In a bullish pin bar, the small real body is located in the upper third of the candle. This indicates that despite selling pressure, buyers were able to push prices back up to close near the high.
- Length of the lower wick: The lower wick of a bullish pin bar must be significantly longer than the real body, typically at least 2-3 times its length. This long wick represents the rejection of lower prices and the dominance of buyers over sellers.
- Upper wick: A bullish pin bar should have little to no upper wick. A significant upper wick would suggest that buyers were unable to maintain control and that the bullish signal may be weakened.
- Context: A bullish pin bar is most significant when it forms in a bullish context, such as at a key support level, after a period of consolidation, or during an established uptrend. A bullish pin bar in a bearish context may be less reliable.

It’s worth noting that the strength of a bullish pin bar can vary depending on its specific characteristics. For example, a pin bar with a very long lower wick and a real body that closes right at the high would be considered a stronger signal than one with a moderately long wick and a real body that closes slightly below the high.
However, context is always key. Even a “perfect” bullish pin bar should not be traded in isolation without considering the broader market structure and other confirming factors.
How to Trade Bullish Pin Bars
There are several ways to trade a bullish pin bar, depending on your trading style and risk tolerance. Some common methods include:
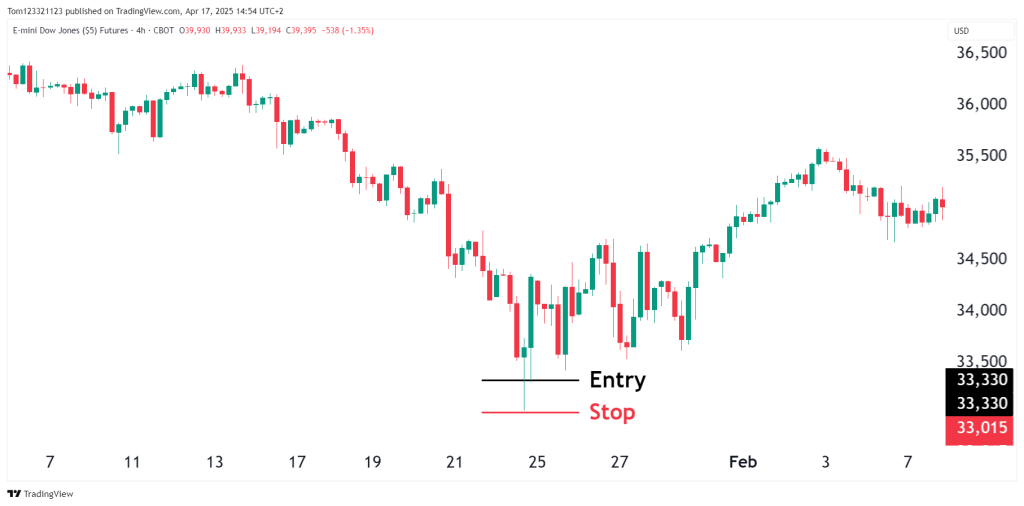
Buy on a break of the pin bar high: Place a buy stop order just above the high of the pin bar. If triggered, this trade assumes that the upward momentum will continue. Place a stop loss below the low of the pin bar.
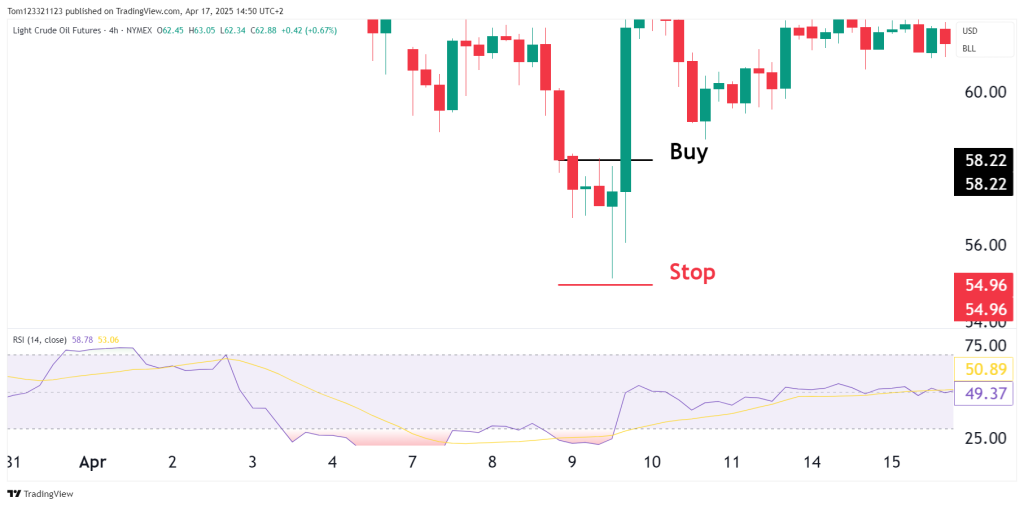
Buy on a pullback to the pin bar low: Wait for prices to retrace back to the low of the bullish pin bar and enter a buy order there. This allows for a tighter stop loss, as the low of the pin bar has already been tested. Place a stop loss just below the pin bar low.
Profit targets can be based on technical levels (e.g., resistance zones, Fibonacci extensions), or by using a fixed reward-to-risk ratio (e.g., 2:1 or 3:1). Always ensure that the potential reward justifies the risk taken.
Bearish Pin Bar Candlestick Pattern
Identifying Bearish Pin Bars
Just as bullish pin bars have specific criteria that define them, bearish pin bars also have unique characteristics that traders should learn to recognize. These include:
- Location of the real body: In a bearish pin bar, the small real body is located in the lower third of the candle. This indicates that despite buying pressure, sellers were able to push prices back down to close near the low.
- Length of the upper wick: The upper wick of a bearish pin bar must be significantly longer than the real body, typically at least 2-3 times its length. This long wick represents the rejection of higher prices and the dominance of sellers over buyers.
- Lower wick: A bearish pin bar should have little to no lower wick. A significant lower wick would suggest that sellers were unable to maintain control and that the bearish signal may be weakened.
- Context: A bearish pin bar is most significant when it forms in a bearish context, such as at a key resistance level, after a period of consolidation, or during an established downtrend. A bearish pin bar in a bullish context may be less reliable.
Like bullish pin bars, the strength of a bearish pin bar can vary depending on its specific characteristics. For example, a pin bar with a very long upper wick and a real body that closes right at the low may be considered a stronger signal than one with a moderately long wick and a real body that closes slightly above the low.
Some key things to look for when confirming a bearish pin bar signal include:
- Alignment with the overall trend: Is the pin bar forming in the direction of the dominant trend on higher timeframes?
- Key resistance levels: Is the pin bar forming at a significant resistance area, such as a swing high, Fibonacci level, or moving average?
- Momentum: Is the pin bar accompanied by bearish momentum indicators, such as a bearish crossover on the MACD or a high reading on the RSI?
- Risk/reward: Does the potential downside target offer an attractive reward compared to the risk of the trade?
Pin Bar Trading Strategy
Pin Bars as Part of a Trading System
While pin bars can be powerful trading signals on their own, they work best when combined with other technical analysis tools and concepts. A well-rounded pin bar trading strategy should consider:
- Trend: Pin bars in the direction of the overall trend are typically more reliable than countertrend pin bars. Look for bullish pin bars in uptrends and bearish pin bars in downtrends.
- Support and Resistance: Pin bars at key support and resistance levels, whether horizontal or diagonal (trend lines), carry more weight than those in the middle of nowhere.
- Confluence: Confluence refers to the alignment of multiple bullish or bearish factors. For example, a bullish pin bar that forms at a key support level with a bullish divergence in the RSI would have confluence. The more confluence, the stronger the signal.
- Risk Management: Always use a stop loss to protect against unexpected moves. Position size appropriately to control risk. Aim for a reward-to-risk ratio of at least 1:1, and preferably 2:1 or higher.
- Candlestick Confirmation: For added confidence, wait for the next candle after the pin bar to close in the expected direction before entering. This helps filter out false signals.
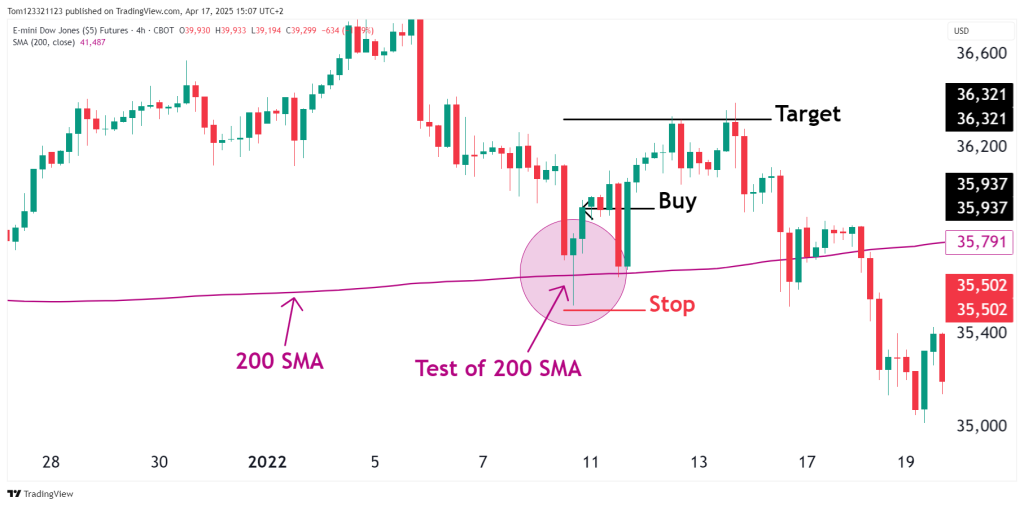
Example Pin Bar Trading System
Here’s a simple pin bar trading system that incorporates some of these concepts:
- Identify the overall trend using a long-term moving average (e.g., 200-day). Only trade pin bars in the direction of the trend.
- Scan for pin bars that form at significant support (for bullish) or resistance (for bearish) levels.
- Wait for the next candle to close above the high (for bullish) or below the low (for bearish) of the pin bar.
- Enter a trade in the direction of the pin bar. For a bullish pin bar, buy on the open of the next candle. For a bearish pin bar, sell on the open of the next candle.
- Place a stop loss just beyond the extreme of the pin bar (below the low for bullish, above the high for bearish).
- Set a profit target at a minimum 1:1 reward-to-risk, but aim for 2:1 or more if possible. Consider using technical levels like Fibonacci extensions or the next major support/resistance zone.
- Manage the trade according to your plan. Consider trailing your stop to lock in profits as the trade moves in your favor.
Remember, this is just one example of how pin bars can be traded. The key is to develop a system that aligns with your trading style, risk tolerance, and market understanding.
Pin Bars on Multiple Timeframes
One advanced pin bar trading technique is to look for alignment across multiple timeframes. When a pin bar on a higher timeframe (e.g., daily) aligns with one on a lower timeframe (e.g., 4-hour), it can provide an even stronger trading signal.
For example, if a daily bullish pin bar forms at a key support level, you could then drop down to the 4-hour chart to look for a bullish pin bar in the same area. If you find one, this could offer a high-probability entry with a tighter stop loss.
Similarly, if a bearish pin bar on the weekly chart aligns with one on the daily chart, it could signal a significant top and potential long-term reversal.
Fake Pin Bar Candlestick Pattern
What is a Fake Pin Bar?
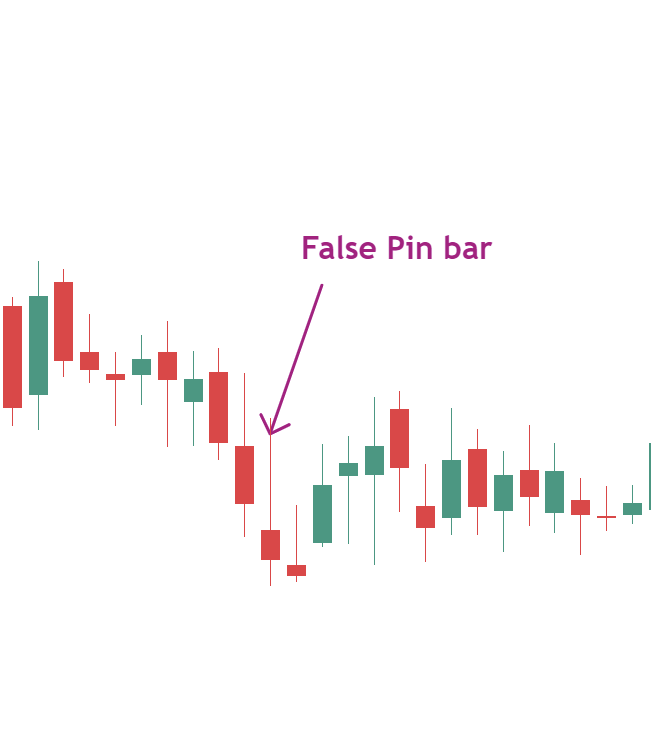
A fake or false pin bar is one that appears to signal a reversal or continuation but is quickly negated by price action moving against it.
Characteristics of a Fake Pin Bar
Some common characteristics of fake pin bars include:
- Forming in the middle of a range or consolidation, without any clear support or resistance levels nearby.
- Having a very small real body relative to the size of the wicks, resembling a doji or spinning top candle.
- Occurring on low volume, suggesting a lack of conviction behind the move.
- Being immediately followed by a strong candle in the opposite direction, negating the pin bar’s signal.
Pin Bar Candle vs Doji
What is a Doji Candle?
A doji is a candlestick pattern where the open and close prices are virtually equal. This results in a very small or non-existent real body, with wicks that can vary in length. Dojis represent indecision in the market, a balance between buying and selling pressure.
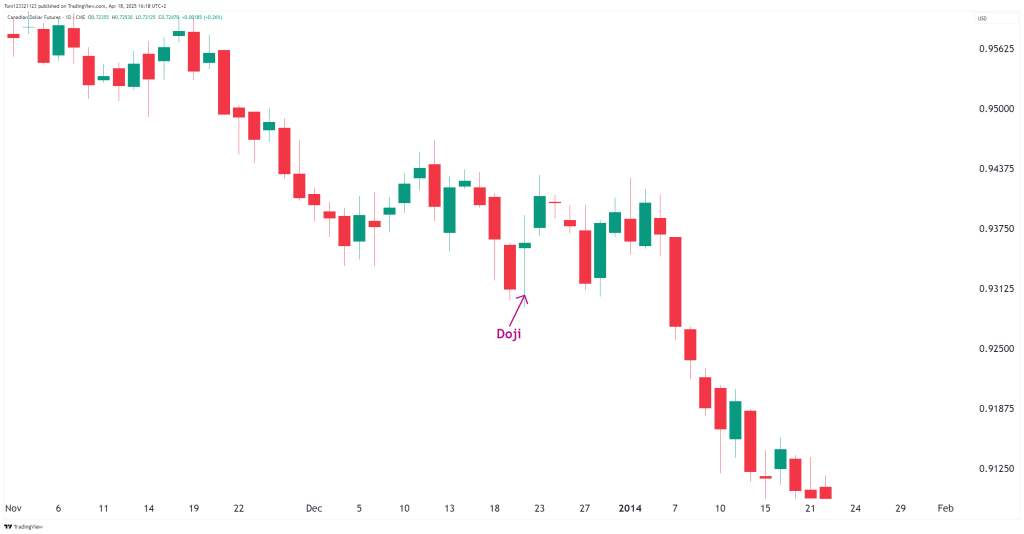
Key Differences Between Pin Bars and Dojis
While both pin bars and dojis have long wicks relative to their real bodies, they convey different market sentiments:
Body Size: A pin bar has a small but visible real body, while a doji’s real body is extremely small or absent.
Wick Proportions: A pin bar must have one long wick that significantly overshadows the other wick and real body. Dojis can have wicks of various lengths, but they are typically more balanced.
Market Sentiment: A pin bar represents a clear rejection of a price level in one direction. A doji indicates indecision, a tug-of-war between buyers and sellers with no clear winner.
Signal Strength: A pin bar is generally considered a stronger trading signal than a doji. While a doji suggests potential trend weakness, a pin bar more clearly identifies the direction of the rejection.
Trading Pin Bars vs Dojis
Because of their differences, pin bars and dojis are often traded differently:
- Pin bars are typically traded in the direction of the rejection, with the assumption that price will continue in that direction. Stops are placed beyond the pin bar’s wick in the opposite direction.
- Dojis are often seen as potential reversal signals, especially after strong trends. Traders might wait for confirmation in the form of a break of the doji’s high or low before entering a trade in the breakout direction. Stops are placed above the high (for short trades) or below the low (for long trades) of the doji.
Pin Bar Candle vs Hammer
What is a Hammer Candle?
A hammer is a bullish reversal candlestick pattern that forms during a downtrend. It has a small real body at the upper end of the trading range and a long lower wick that’s at least twice the size of the body. The hammer means that despite selling pressure driving prices lower during the period, buyers were able to push prices back up to close near the high. This often leads to a complete reversal of the trend.
Similarities Between Pin Bars and Hammers
Pin bars and hammers share some key characteristics:
- Both have small real bodies relative to their wicks.
- Both have long wicks that show rejection of a price level.
- Both can signal potential trend reversals.
Key Differences Between Pin Bars and Hammers
Despite their similarities, there are important differences between pin bars and hammers:
- Specific Criteria: A hammer must have a lower wick that’s at least twice the length of the real body, with little or no upper wick. A pin bar’s wick must be at least 2-3 times the body length, but can be either upper or lower.
- Trend Context: A hammer is only considered valid after a downtrend and signals a potential bullish reversal. A pin bar can form in any trend context and can signal a reversal or continuation.
- Bullish vs Bearish: A hammer is inherently bullish, while a pin bar can be either bullish (rejecting lower prices) or bearish (rejecting higher prices).
Basically, a hammer is a specific type of bullish pin bar that forms after a downtrend. All hammers can be considered pin bars, but not all pin bars are hammers.
FAQs
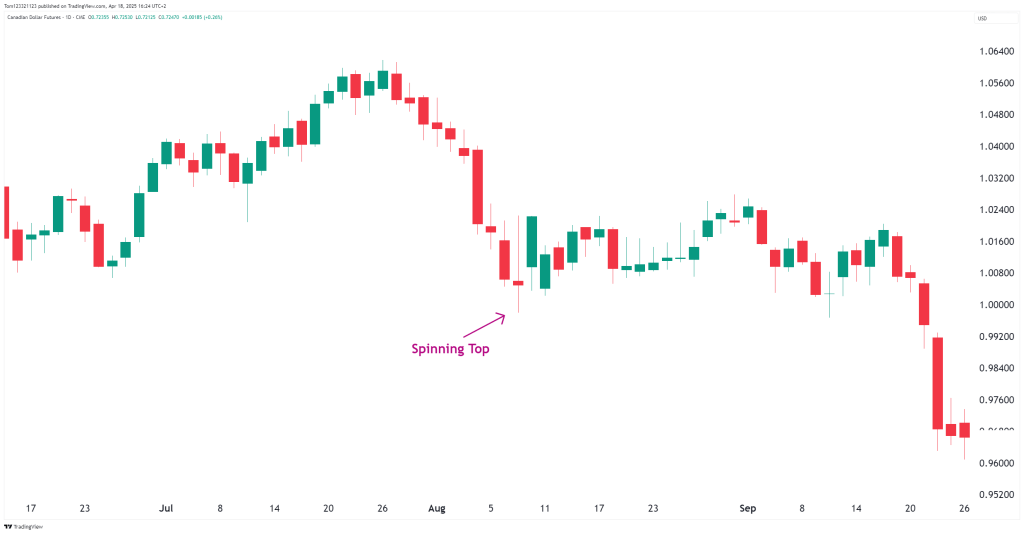
Can a spinning top candle be considered a pin bar?
While a spinning top candle does have a small body relative to its wicks, like a pin bar, it doesn’t meet the specific criteria of a pin bar. A pin bar must have one wick that is significantly longer than the other wick and the real body. A spinning top has more balanced proportions and represents indecision rather than clear rejection of a level.
Do pin bars work on lower timeframes like 1-minute or 5-minute charts?
Pin bars can form on any timeframe, but they tend to be more reliable and significant on higher timeframes like the 4-hour, daily, or weekly charts. Lower timeframe pin bars can be more prone to noise and false signals. On lower timeframes, it’s especially important to look for confluence with higher timeframe levels and trends to improve the odds of success.
What is the best place to put a stop loss on a pin bar trade?
The most logical place to put a stop loss on a pin bar trade is just beyond the extreme of the pin bar in the opposite direction of the trade. For a bullish pin bar trade, the stop would go below the low of the pin bar. For a bearish pin bar trade, the stop would go above the high of the pin bar. This way, if price violates the pin bar’s rejection area, the trade is automatically exited.
Are pin bars better for day trading or swing trading?
Pin bars can be effective for both day trading and swing trading, depending on the timeframe used. A day trader might use 5-minute or 15-minute pin bars to identify short-term reversals or breakouts, while a swing trader could use daily or weekly pin bars to spot potential multi-day or multi-week moves.
The key in either case is to match the timeframe of the pin bar to your trading style and to always confirm the signal with other supportive factors like trend, momentum, and key levels. Generally, higher timeframe pin bars (4-hour and up) may be more suitable for swing trading, while lower timeframe pin bars (1-hour and below) may be more appropriate for day trading.
Conclusion
The pin bar is a highly effective candlestick pattern that can signal trend reversals or continuations across all markets and timeframes. By understanding the psychology behind pin bars, how to identify high-probability setups, and how to effectively manage pin bar trades, traders can greatly improve their technical analysis skills.
However, it’s crucial to remember that no single candlestick pattern is foolproof. Pin bars, like any other technical signal, should always be considered in the context of the broader market structure.
The best pin bar trades are those that align with the overall trend, form at key technical levels, and are supported by other tools like momentum indicators or chart patterns. By combining pin bars with sound risk management and a well-defined trading plan, traders can harness the power of this candlestick pattern while minimizing the impact of false signals.
Ultimately, successful trading with pin bars (or any pattern) comes down to practice, discipline, and continuous education.