


Introduction
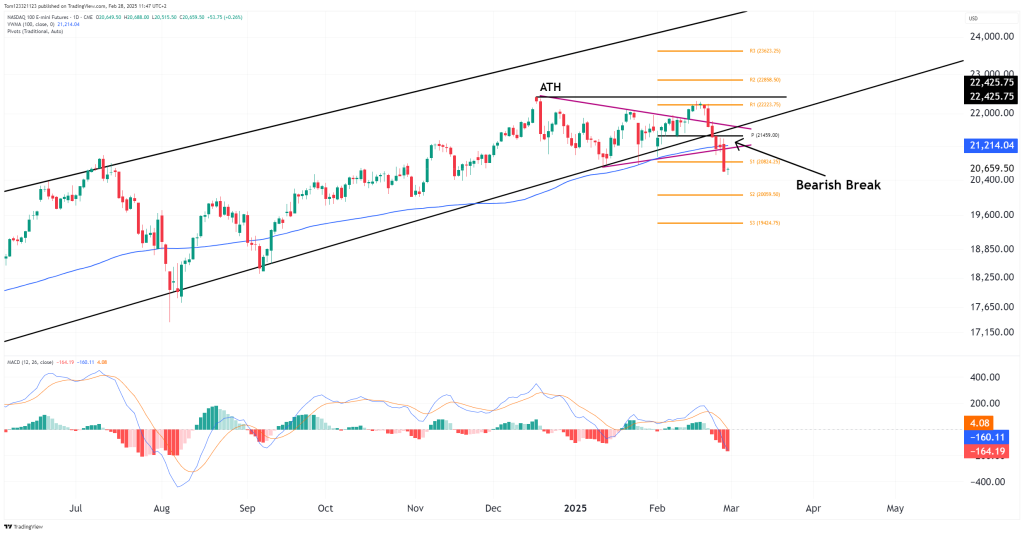
NASDAQ 100 E-mini futures (NQ) have broken below their long-term ascending trendline, signaling a potential shift in market momentum. The index failed to reclaim its all-time high (ATH) at 22,425.75, leading to a breakdown that has taken price below key support levels.
As of today, NQ is trading at 20,676.25, up +0.34%, attempting to stabilize after a sharp decline. However, the technical breakdown below the long-term trendline and the 100-day VWMA (21,214.09) could mean that bulls are starting to lose control, or is it just a bear trap?
Market Drivers & Key News Events
- Tech-Led Pullback: After a strong rally, big tech stocks have seen profit-taking, leading to weakness in the NASDAQ. The recent rotation into value stocks and defensive sectors has further weighed on sentiment.
- Fed Uncertainty & Inflation Risks: Investors remain cautious as inflation remains elevated, making the timeline for rate cuts uncertain. This has created headwinds for high-growth sectors like tech.
- Bearish Technical Breakdown: The break below 21,214.09 (100-day VWMA) has triggered additional selling pressure, with technical traders now looking at lower support levels.
Technical Outlook
Bearish Break Below Trendline—Downside Risk Increases
- Price has dropped below the long-term ascending trendline, which had previously supported the bullish structure.
- The 100-day VWMA (21,214.09) has been lost, increasing downside risk unless price reclaims this level quickly.
- MACD is firmly bearish, with momentum accelerating to the downside.
Key Support & Resistance Levels
- Resistance Levels:
- 21,214.09 (100-day VWMA – Key Level to Reclaim for Bulls)
- 22,223.75 (R1 Pivot – Short-term Upside Target if Recovery Begins)
- Support Levels:
- 20,424.25 (S1 Pivot – Immediate Support Zone)
- 20,059.50 (S2 Pivot – Next Major Support Below)
- 19,942.75 (S3 Pivot – Deeper Correction Level)
If NQ fails to reclaim 21,214.09, it remains vulnerable to further downside, with potential support at 20,424.25 and 20,059.50.
Bull & Bear Scenarios
Bull Case: Recovery Above 21,214.09
- If price climbs back above 21,214.09, bulls could regain control, targeting 22,223.75.
- A false breakdown scenario (bear trap) is possible, but confirmation is needed.
Bear Case: Continuation Toward 20,059.50
- If NQ fails to reclaim lost support, it remains vulnerable to a move toward 20,424.25 and 20,059.50.
- The breakdown below the long-term trendline suggests further downside is likely.
Final Outlook
- Short-Term (1-2 Weeks): Bearish, watching if price can reclaim 21,214.09.
- Medium-Term (1-3 Months): Cautiously bearish unless price moves back above 21,214.09.
- Long-Term (6+ Months): Trend is now at risk unless price holds 20,059.50.
