Introduction: Why Smart Traders Use the Klinger Oscillator
Most traders rely on common indicators like RSI, MACD, and moving averages. While these tools are useful, they focus primarily on reacting to price movements. The limitation is simple. Price does not always reflect the strength behind a move like the Klinger oscillator does.
The Klinger Oscillator approaches this differently by incorporating volume. This allows traders to assess whether a move is supported by real participation or likely to fade. For traders, consistency and risk control are very important; this additional layer of confirmation can help reduce and filter out bad trades and improve a system’s overall expectancy.
What Is the Klinger Oscillator?
The Klinger Oscillator is a volume-based momentum indicator that tracks the flow of money into and out of an asset. By combining price and volume, it helps traders identify trend direction, potential reversals, and divergence.
How the Klinger Oscillator Works
The indicator is built around the idea of volume force, which measures how volume interacts with price over time.
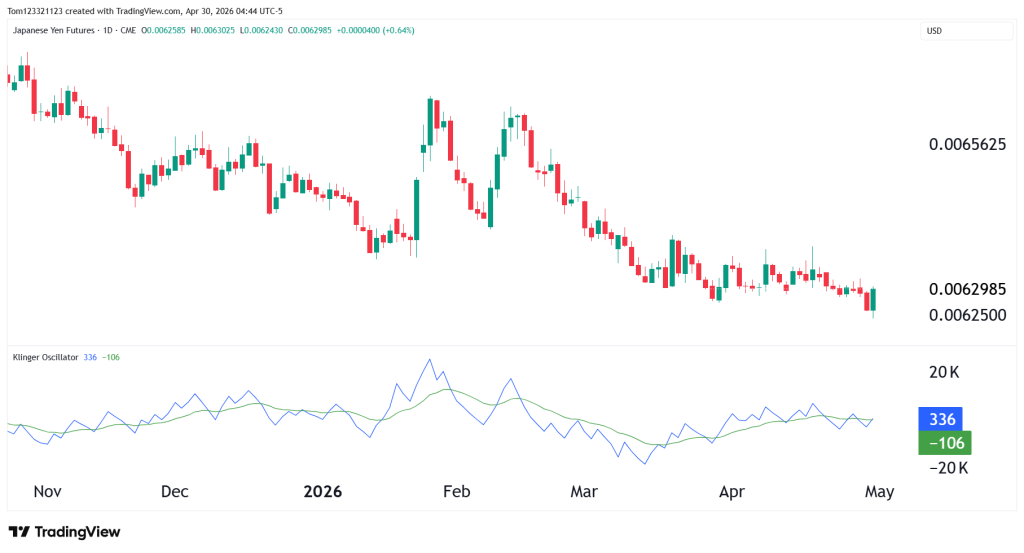
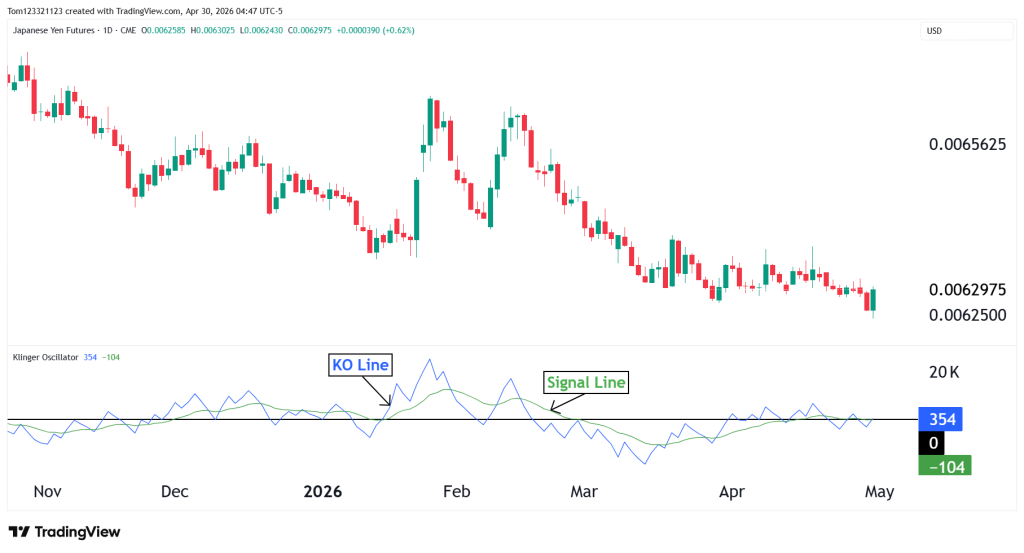
It consists of three main elements: the Klinger line, which reflects momentum driven by volume, a signal line that smooths that movement, and the zero line, which separates bullish and bearish conditions. What makes this useful in practice is that volume often shifts before price does. When momentum begins to change beneath the surface, the Klinger Oscillator can highlight it earlier than price-only indicators.
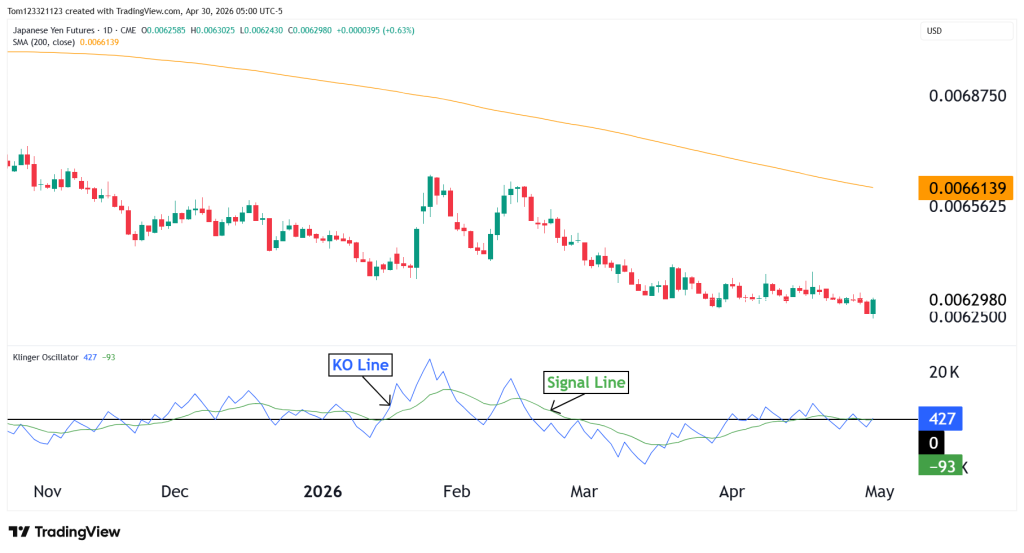
We see this in the chart below at the point where we have the KO Line labeled. The volume surges first, then the price follows after that. It is not to say that we don’t get any price movement with the volume, but rather that volume comes before the movement of price.
Best Klinger Oscillator Settings
The most commonly used settings are 34 (fast EMA), 55 (slow EMA), and 13 for the signal line.
These settings provide a balance between responsiveness and stability. They allow the indicator to react to meaningful shifts in momentum without becoming too sensitive to short-term noise. Because of this, the 34, 55, 13 configuration is widely used across platforms like TradingView and works well across most markets and time frames.
How to Use the Klinger Oscillator on TradingView
Setting up the indicator is straightforward. Once applied, it becomes more effective when combined with a simple trend filter.
- Open TradingView
- Add the Klinger Oscillator
- Keep the default settings (34, 55, 13)
- Apply a 200-period moving average to price
The moving average gives a view of the long-term trend. Instead of taking every signal, traders can focus only on setups that align with this trend.
Klinger Oscillator Strategy
The Klinger Oscillator works best when it’s used alongside other indicators, rather than on its own. The goal is not to trade every signal, but to focus on those that align with both the long-term trend and momentum.
Bullish Setup
A typical long setup forms when:
- The Klinger line crosses above the signal line
- Momentum shifts above the zero line
- Price is trading above the 200 moving average
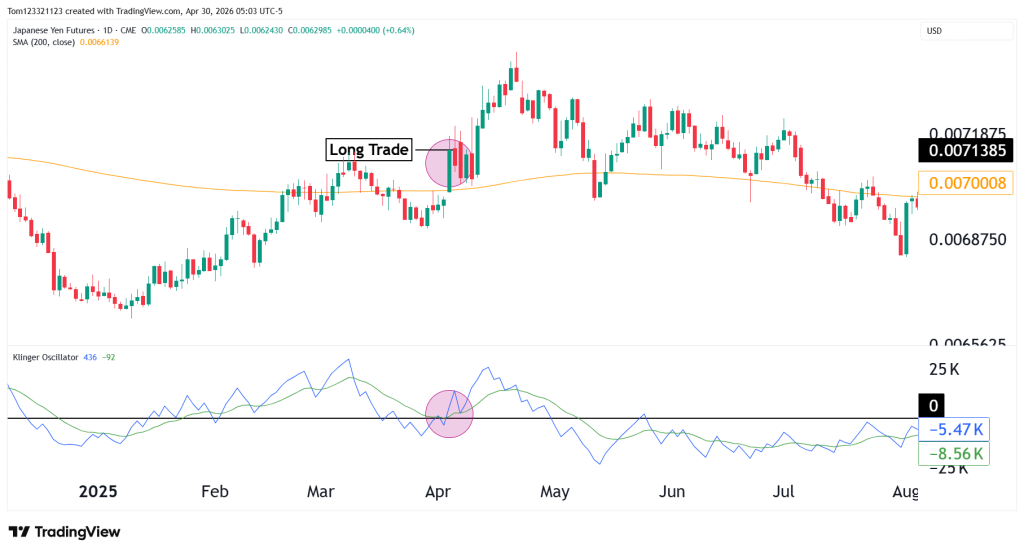
In the image below, we can see the KO line (blue) crosses above the signal line (green), the price is above the 200-day moving average, and the Klinger oscillator is above 0. This is a ‘by-the-book’ Klinger oscillator long trade. Targets can be set based on risk-to-reward ratios, or simply when the KO line does not make any new highs or crosses below the signal line.
Bearish Setup
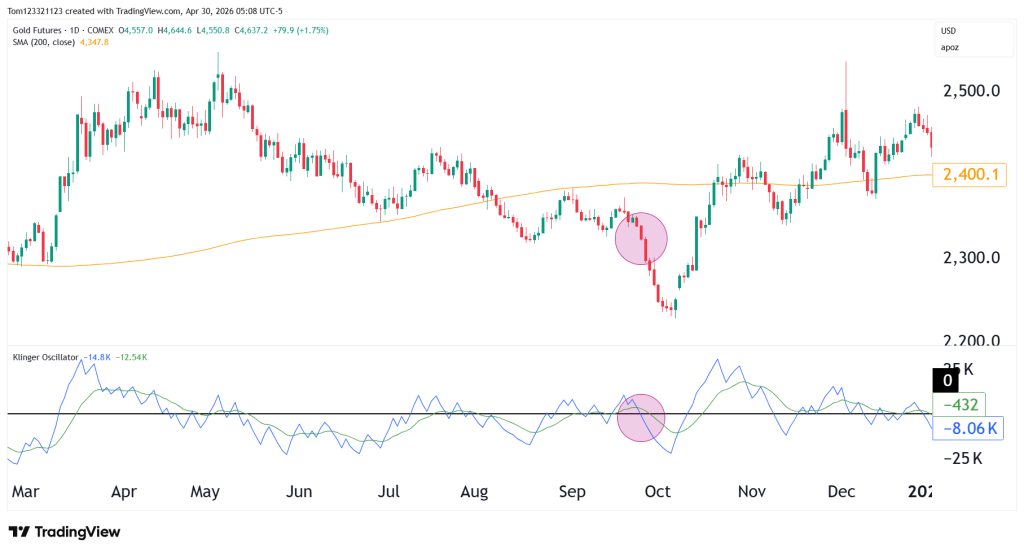
A short setup follows the same logic in reverse:
- The Klinger line crosses below the signal line
- Momentum moves below the zero line
- Price is trading below the 200 moving average
This indicates increasing selling pressure supported by volume, rather than isolated price movement.
Divergence: Where the Indicator Adds the Most Value
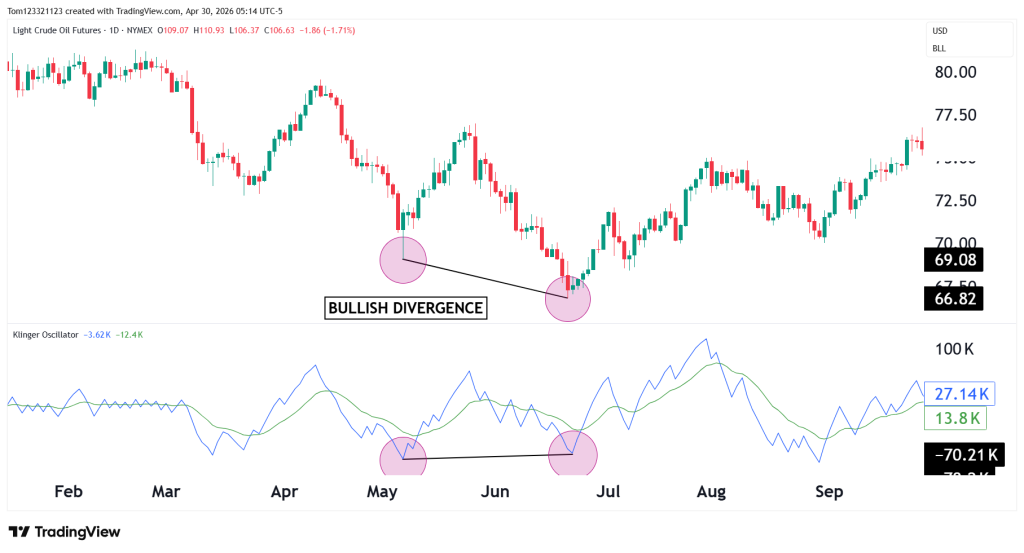
One of the more useful ways to trade the Klinger Oscillator is with divergence. When price and momentum begin to move out of sync, it can signal that a trend is weakening even before a clear reversal forms.
- If price is making lower lows while the indicator forms higher lows, selling pressure may be fading
- If price is making higher highs while the indicator forms lower highs, upward momentum may be slowing
Below is a chart of bullish divergence forming. This is generally a stronger signal than a divergence created by the relative strength index because the Klinger oscillator factors in the volume.
Why Use a 200 Moving Average Filter?
One of the most common issues traders face is taking signals in the wrong direction. The 200-period moving average helps solve this by acting as a simple trend filter. When price is above it, the focus is on long setups. When price is below it, the focus shifts to short setups.
This removes a large portion of low-quality trades by keeping decisions aligned with the long-term trend, rather than reacting to every short-term signal.
In simple terms, the 200 moving average provides context. It shows the broader direction of the market, allowing traders to filter out signals that go against that direction.
Risk Management
Even with a trend filter in place, no indicator or setup is reliable on its own.
The way trades are managed has a greater impact on long-term results than the signal itself. Poor risk management can turn a good strategy into inconsistent performance, while strong risk control can help stabilize results over time.
Stops are typically placed beyond the recent structure, rather than directly on the indicator. Targets should maintain a positive risk-to-reward ratio, and position sizing should remain consistent from trade to trade.
Over time, combining a clear trend filter with disciplined risk management is what leads to more consistent decision-making.
When It Works Best (and When It Doesn’t)
The Klinger Oscillator performs best in trending markets, where price is moving with a clear direction, and volume supports that movement.
In these conditions, shifts in momentum tend to be more meaningful. Crossovers and movements around the zero line are more likely to reflect genuine changes in buying or selling pressure, rather than short-term fluctuations. In slower or ranging markets, this becomes less reliable. Price moves back and forth without strong participation, and the indicator can produce frequent crossovers that don’t lead to sustained moves.
This is where many traders run into trouble. The issue is often not the indicator itself, but using it in conditions where it is less effective.
Understanding this distinction is important. The Klinger Oscillator is designed to highlight momentum within trends, not to perform equally well in all market environments. Recognizing when conditions are favorable can make a noticeable difference in how useful the signals actually are.
Common Mistakes
As with most indicators and tools in trading, the issues with the Klinger Oscillator stem from how it’s used rather than from the indicator itself.
A common mistake is treating every crossover as a signal on its own. Without a thorough technical analysis, these signals can appear frequently, but can’t really be traded on. Ignoring the zero line or using the indicator without a trend filter often leads to the same problem — taking trades that do not have high probabilities.
The indicator is most effective when it’s used selectively, not reactively. Crossovers and momentum shifts carry more weight when they align with trend and structure, rather than being taken in isolation.
Focusing on context instead of signals alone is what separates more consistent use from inconsistent results.
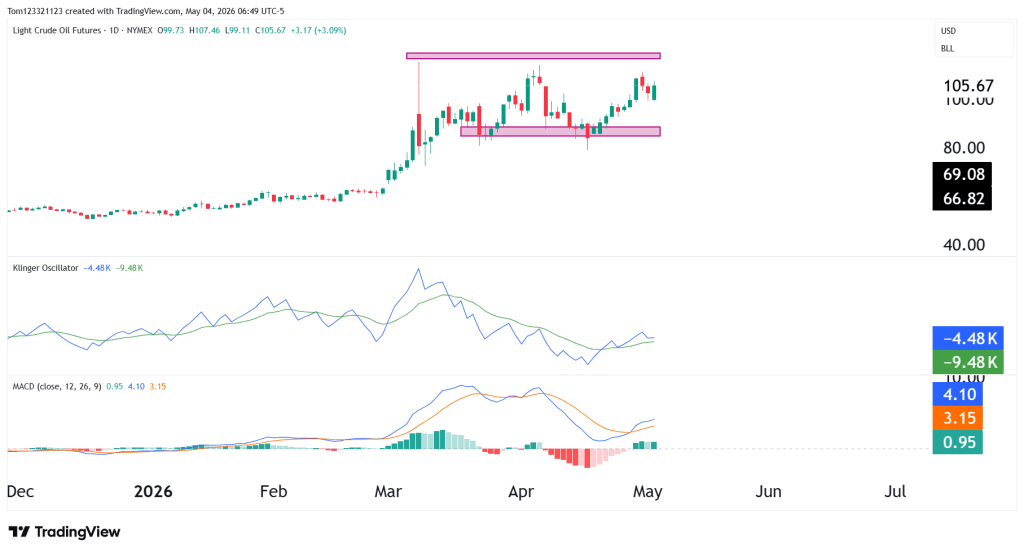
Klinger Oscillator vs MACD
While both indicators measure momentum, they approach it in different ways.
The MACD is based entirely on price, which makes it useful for identifying shifts in trend and general momentum. However, it does not account for the level of participation behind those moves.
The Klinger Oscillator, on the other hand, incorporates volume. This allows it to provide additional context around whether a move is supported by strong buying or selling activity, rather than relying solely on price changes.
In practice, this distinction becomes more noticeable during key turning points. Price can continue moving in one direction while underlying volume begins to shift. Because of this, the Klinger Oscillator can sometimes highlight weakening momentum earlier, particularly in trending conditions.
Neither indicator is inherently better in all situations, but understanding how they differ allows traders to choose the tool that best fits their approach.
Conclusion: Is It Worth Using?
The Klinger Oscillator helps you understand momentum by adding volume into the picture. When you use it with the overall trend and manage risk properly, the signals become more reliable. For most traders, the real improvement comes from being more selective. Fewer trades, but better ones. Used this way, the Klinger Oscillator becomes a practical tool you can rely on, not just another indicator on the chart.