

On Tuesday, gold prices rose slightly as investors awaited a series of US economic data releases this week. The data is expected to provide insights into the Federal Reserve’s plans for interest rate cuts. Daniel Pavilonis, senior market strategist at RJO Futures, commented that the gold market is hovering just above the $2,000 mark, with Read More…
Month: January 2024

Greyscale dumps Bitcoin; what now?
Weekly Chart Analysis: Price has formed a large rounding bottom pattern and parabolic curve, typically considered a bullish reversal signal. The price was approaching the all-time high (ATH) resistance zone, near $69,435, before swiftly pulling back after greyscale started dumping on the market. We should monitor this level closely; a decisive weekly close above the Read More…
Equities Rally as S&P 500 Hits Another Record High
On Monday, equities rallied as the S&P 500 set another record high, driven by gains in tech stocks. Meanwhile, investors awaited corporate reports for insights into this year’s profit outlook. Additionally, on Friday, the S&P 500 confirmed its bull market status since its low on October 12. Top tech companies like Microsoft and Apple will Read More…
Crude Oil Futures (CL) quickly turning bullish
Weekly Chart Analysis: Looking at the weekly chart, we observe that Light Crude Oil Futures have recently bounced off a consolidation zone around the $74.88 level, indicating a potential bullish breakout. Last week’s candlestick closed above this zone, and this week’s candle is turning green already. A sustained hold above $74.00 could see us targeting Read More…
Currency Futures End Mixed in Response to Friday’s Economic Reports
Currency futures were mixed on Friday amid varied economic reports. At the same time, the dollar ended its recent winning streak. Still, it was a bullish week for the dollar because Fed rate cut bets went down with more positive data and hawkish remarks from Fed officials. US consumer sentiment (Source: University of Michigan) The Read More…
Bulls in full control as S&P 500 (ES) Surges
Weekly Chart Analysis: The price of ES has made a significant move by closing above the all-time high (ATH), which suggests a strong bullish bias. We see a clear break above the previous resistance level, which bulls want to see serve as support in any potential retest. If you’re looking for a bullish confirmation of Read More…
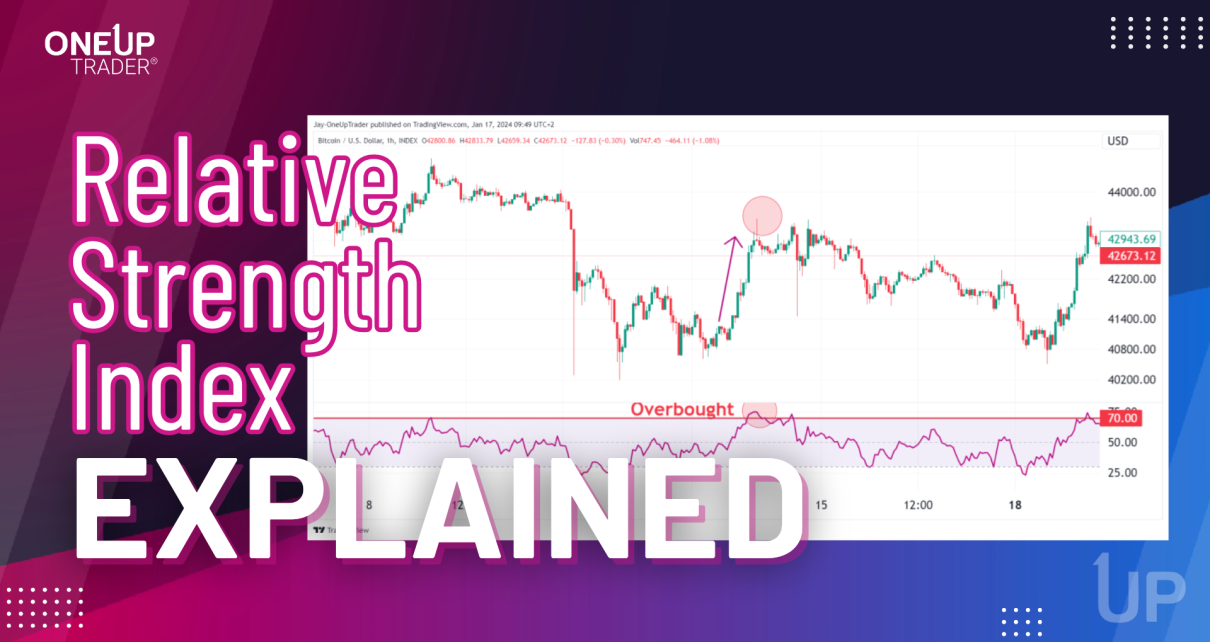
Relative Strength Index (RSI) Indicator Explained
Introduction As a trader, having the right indicators in your toolbox can mean the difference between successful trades and costly mistakes. One of the most powerful and versatile tools available is the relative strength index (RSI indicator). Virtually every trader knows about the RSI, but are you using it to its full potential? In this Read More…
IEA and OPEC’s Upbeat Predictions Lift Oil Prices
On Thursday, oil prices rose as the International Energy Agency and the OPEC producer group predicted robust growth in global oil demand. At the same time, severe winter weather disrupted US crude output. Moreover, the government reported a significant weekly decrease in crude inventories. There was a larger-than-expected draw in crude inventories, totaling 2.5 million Read More…
Equities Dip as December Retail Sales Exceed Forecasts
On Wednesday, Wall Street equities closed lower as December US retail sales data beat expectations. These sales figures dampened hopes for an early start to the Fed’s rate-cut campaign in March. The optimistic sales report on Wednesday prompted economists to revise upward their growth estimates for the fourth quarter. Moreover, the report comes after solid Read More…
Gold futures (GC) MACD bearish, but POC bullish
Weekly Chart The weekly chart shows how significant the false break has been in GC with bulls still unable to push through. The recent ‘Failed Attempt’ to break above this level is beginning to show signs of exhaustion from the bulls. Immediate support is seen at the rising trendline, currently near the 1974.4 mark. A Read More…