The U.S. Dollar Index is forming a converging pattern on the weekly chart, suggesting a potential breakout could happen soon. This pattern is known as a symmetrical triangle, and it often leads to significant price movements after a period of consolidation following an upward move.
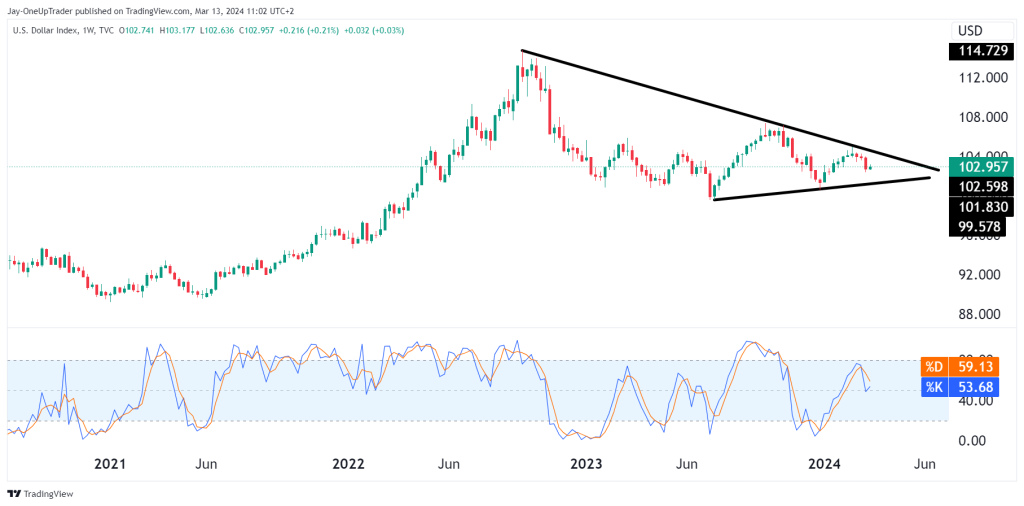
Weekly
Looking at the weekly chart, the DXY is in the late stages of the triangle, with the price action narrowing between the trend lines. The index’s movement has been confined, setting the stage for increased volatility. The convergence point of the pattern is approaching, indicating that traders should prepare for a potential breakout.
The Relative Strength Index on the weekly timeframe is neutral, hovering around 59.13, which means the index could move in either direction without the immediate risk of being overbought or oversold.
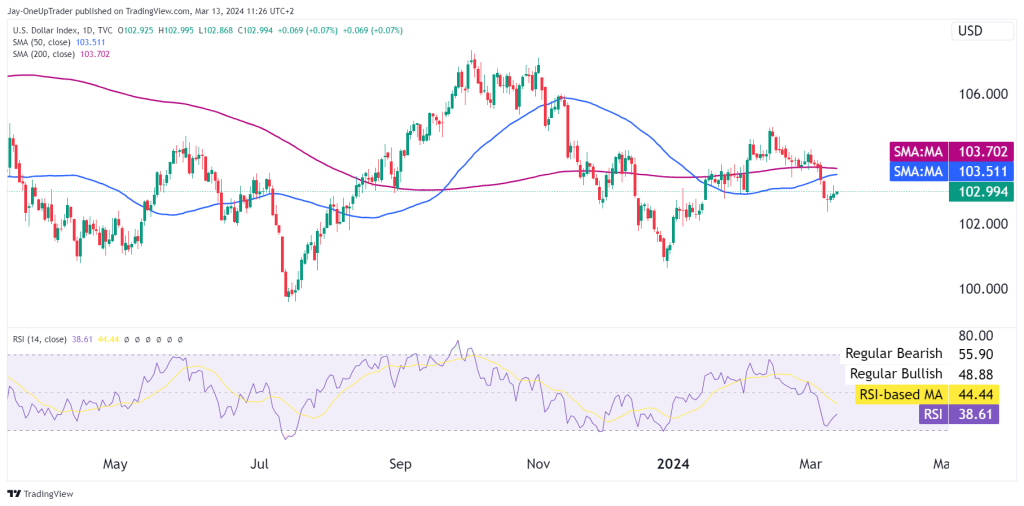
On the daily chart, the DXY is fluctuating around the 50-day and 200-day Simple Moving Averages, currently at 103.510 and 103.701. This indecision is reflected in the converging SMAs and underscores the importance of the upcoming breakout direction.
Potential Trades:
- Breakout Trade (Weekly Chart): Traders should monitor the triangle pattern for a breakout. A decisive close above the upper trendline could be a signal for a long position, with a target at previous resistance levels around 103-104. Conversely, a break below could signal a short position, targeting support levels near 100 or lower.
- Mean Reversion (Daily Chart): For short-term traders, a move towards the oversold RSI region might offer a mean reversion opportunity. A long position could be taken near the lower boundary of the RSI channel with a tight stop-loss, expecting a retest of the 50-day SMA as a potential target.
Overall Rating: Neutral with a bullish bias on the weekly chart due to the continuation pattern, and a short-term bearish bias on the daily chart as the price struggles with the SMAs. It’s crucial for traders to await a confirmed breakout of the weekly symmetrical triangle to establish a clearer directional bias. Until then, short-term trades based on the daily SMA and RSI levels could be considered. Always ensure proper risk management and stop-loss measures are in place.