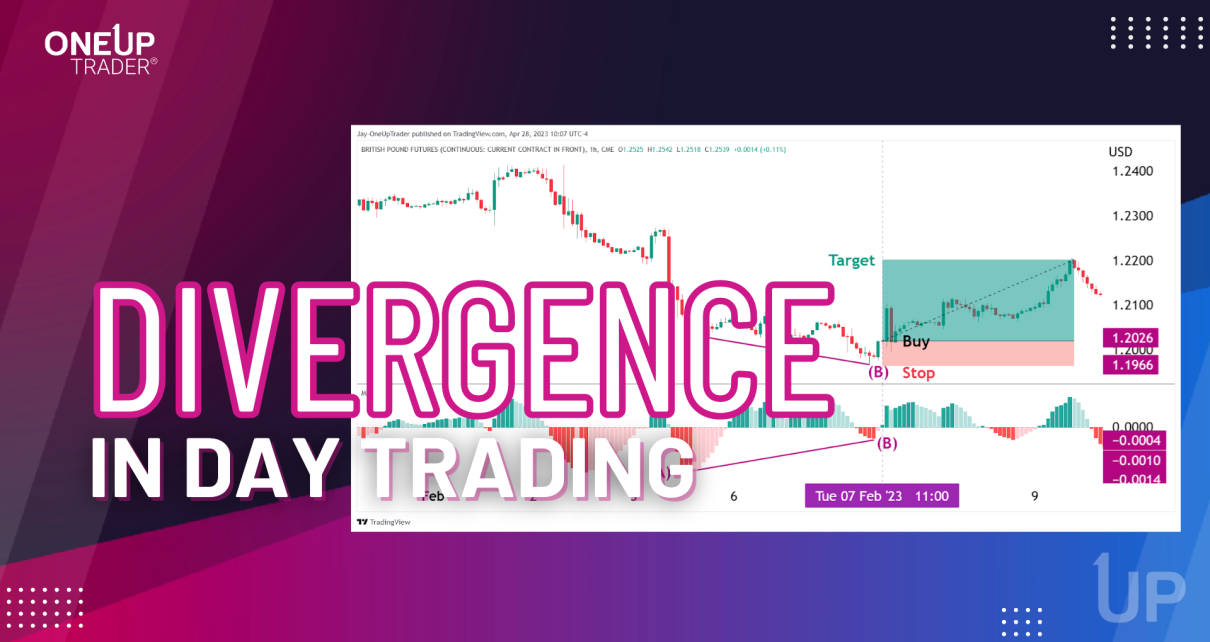
Bitcoin Futures continue to fly as the cryptocurrency has secured a position among the top assets in the world. The recent move above $69,435 has traders considering the possibility of an extended rally, potentially reaching the Fibonacci extension level of $102,975, which may be the next cycle high. The Relative Strength Index on the daily Read More…
Tag: stock market
Dollar Index in a Tight Coil, Technical Analysis
The U.S. Dollar Index is forming a converging pattern on the weekly chart, suggesting a potential breakout could happen soon. This pattern is known as a symmetrical triangle, and it often leads to significant price movements after a period of consolidation following an upward move. Weekly Looking at the weekly chart, the DXY is in Read More…
Dow Futures Climb, Technical Analysis
Examining the weekly chart, the index has firmly established support within the 36,000 region, demonstrated by the green box marking previous resistance now turned support. The Relative Strength Index on the weekly timeframe reflects strong buying interest with a reading above 74. While this indicates a powerful bullish push, traders should be cautious of the Read More…
Equities Slide Ahead of Pivotal US Inflation Data Release
Equities ended slightly lower on Monday ahead of US inflation data that might shape the outlook for Fed rate cuts. Investors were cautious, avoiding big positions as they awaited the US CPI report. Additionally, they took profits after Friday’s job report, which revealed weakness in the US labor market. The US will release the Consumer Read More…
Bitcoin’s Rally Eyes $69k Peak as Bulls Charge
Bitcoin’s remarkable rally has the cryptocurrency community buzzing as it nears the previous all-time high (ATH) of approximately $68,900. A technical analysis of the daily and weekly charts reveals a sustained upward trend that invites optimism for continued bullish momentum. The daily chart showcases Bitcoin’s substantial break above both the 50-day Simple Moving Average (SMA) Read More…
Technical Analysis for E-Mini Russell 2000 Index Futures:
Russell has been severely lagging the big indices with 1 year performance at 7%, while NQ has posted a 47% increase in the same period. Is it finally time for the small caps to catch up? Weekly Key Levels to Watch on the Weekly: Daily Key Levels to Watch on the Daily: Potential Trades: Always Read More…


