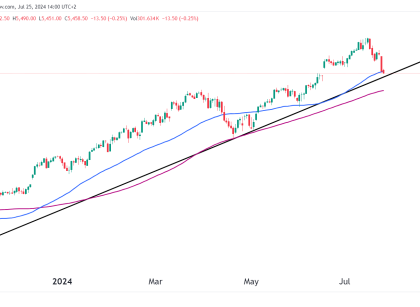
Technical Analysis

T-Bond Futures (ZB) Technical Update

Introduction The T-Bond Futures (ZB) market exhibits a notable consolidation forming on the daily chart, with current price action gravitating towards the 50 and 100 moving averages, signaling potential shifts in market sentiment for the time being. Daily Chart Analysis It is clear that ZB has been a short sellers dream for the past few Read More…

Fundamental Analysis

Equities Make Modest Gains After Mixed Fed Signals

On Tuesday, US equities gained modestly as investors analyzed mixed remarks from Federal Reserve officials. Upbeat consumer data added to the positive sentiment. The three major US stock indexes initially lost momentum but closed in positive territory after a range-bound session. Market participants are closely examining comments from monetary policymakers ahead of the FOMC meeting Read More…

Fundamental Analysis

Equities Take a Breath After Thanksgiving

Equities drifted lower on Monday as investors paused after Thanksgiving, anticipating crucial economic data during the bustling holiday shopping season.  According to Adobe Analytics, Cyber Monday is projected to drive record spending of $12 billion, enticing shoppers with online deals. This upbeat sign reflects the strength of the American consumer, who contributes about 70% to Read More…

Technical Analysis

Crude Oil Futures (CL) Technicals: Bulls Get Fired Up

Weekly Chart Analysis:The weekly chart gives us a broader perspective and a longer-term view that we use for our trend analysis which means the weekly doesn’t necessarily have to be a chart we look at taking positions. The noteworthy psychological $100 level stands out, but before we get there, let’s focus on the more immediate Read More…

gold technical analysis futures oneup trader funded trader program
Technical Analysis

Bullish Sentiment Remains High In Gold Futures (GC)

Last week, we analyzed the price action in Gold and maintained a bullish stance on the yellow metal. As we look at the updated price discovery, nothing has changed with GC now moving into a price level to test an important resistance level at $2019. The Gold chart shows a significant recovery from a support Read More…