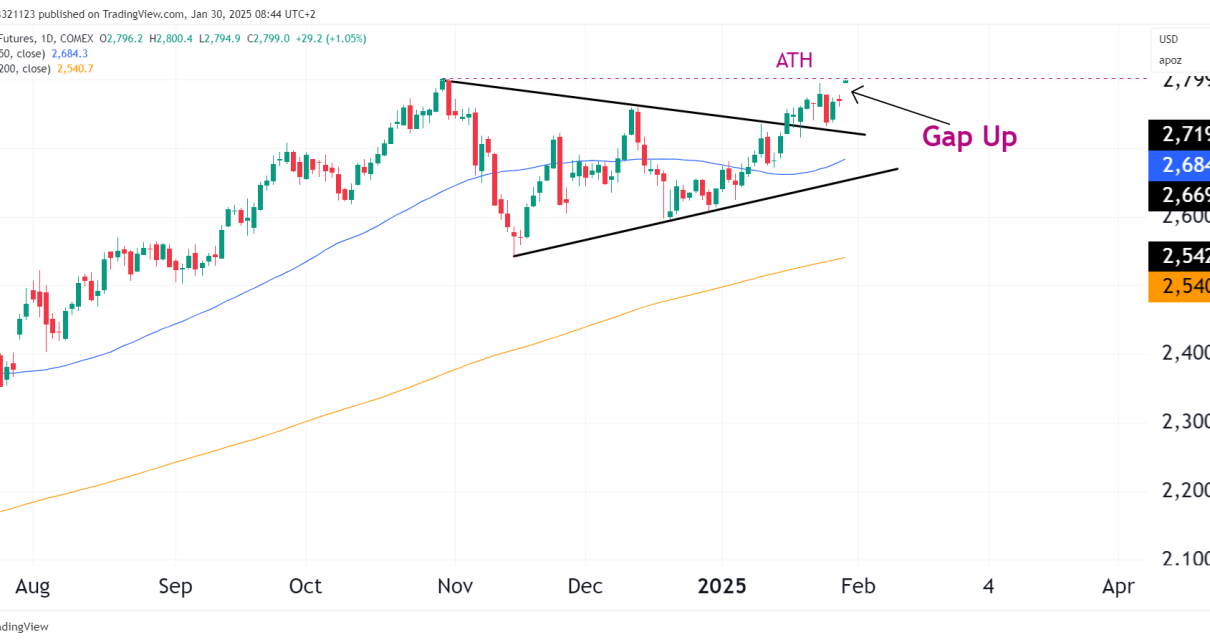
A Bart Simpson Pattern on 4 Hour chart Anticipating Long opportunities around key levels Bart Simpson Pattern A Bart pattern has been completed on the 4 hourly charts. It’s usually a good pattern to trade in a downtrend as a continuation pattern. However, since the price has retraced into the multi-year support zone, we expect Read More…
Tag: stock market
Nasdaq-100 (NQ) Futures Rally As UN Urges the Fed To Halt Rate Hikes
The UN and other Economists Urge Fed To Halt Rate Hikes NQ Bouncing Off Yearly Lows False Break Candle Setup UN Urges Fed To Halt Rate Hikes Even though these articles are focused on technical analysis, we cannot forget the macro-economic picture because it can significantly impact our technical decisions. The UN has urged the Read More…
E-mini S&P 500 (ES) Futures Barely Holding Support
The yearly low support breached. What the correlation between the major indices tells us Lackluster price action on the shorter time frames Yearly Support Breached The E-mini S&P 500 (ES) traded at the yearly low of $3,639 for the first time since June; prices actually breached the low before moving back upward and have been Read More…
Technical Outlook: E-mini Dow Jones (YM) Futures
Medium Term Outlook on Weekly Chart looks bearish Fibonacci Fan & Retracements Show more downside potential Possible Scalping opportunities abound for the Bulls Medium Term Outlook The fact that YM has broken below the previous 2022 low, coupled with the Feds stance on interest rate policy, gives much power to the bear case. There is Read More…
Multi-year Support Broken On Gold Futures (GC)
A recap of last week’s analysis. Multi-year support broken to the downside after 2 years A look into the Fibonacci Fan Analysis Last Week’s Recap Two potential scenarios were given for GC in our analysis from last week. Scenario two has played out with the gold price finally breaking below the multi-year support, which has Read More…
Market Outlook: E-min Nasdaq 100 Futures (NQ)
NQ is only 200 points away from its yearly lows. The momentum indicator is firmly in the negative. Why it could be time to sit on our hands. Recap of last week’s analysis We pointed out the potential bearish target of $11,592.75, which was our 78% Fibonacci level. It was a clear target for bears, Read More…