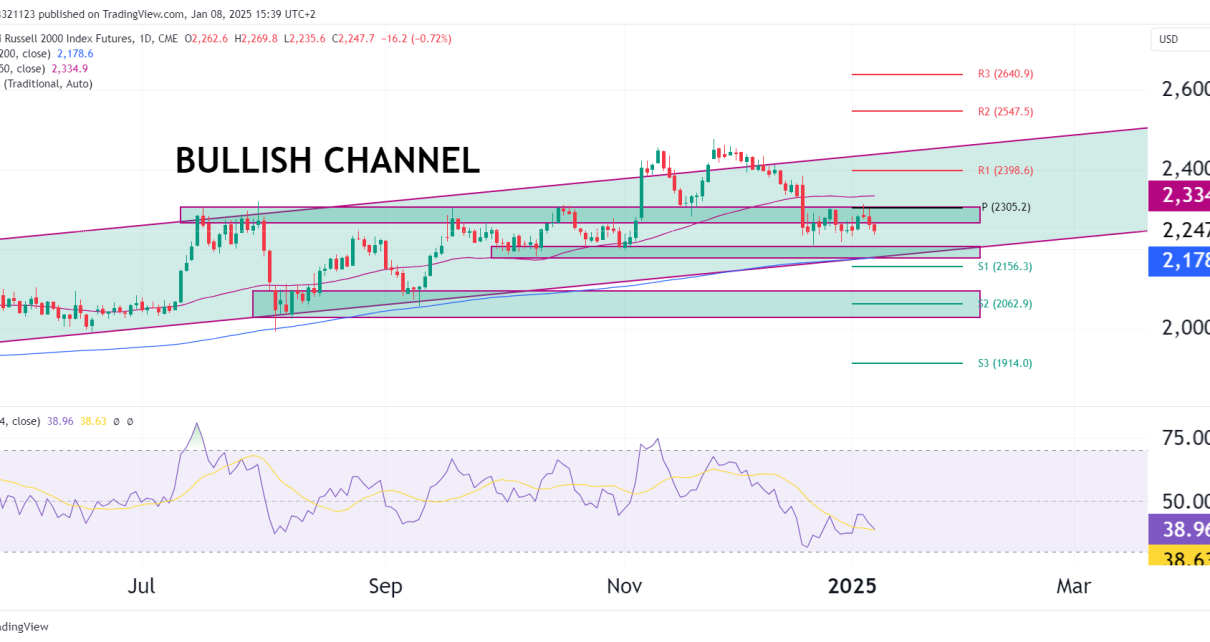
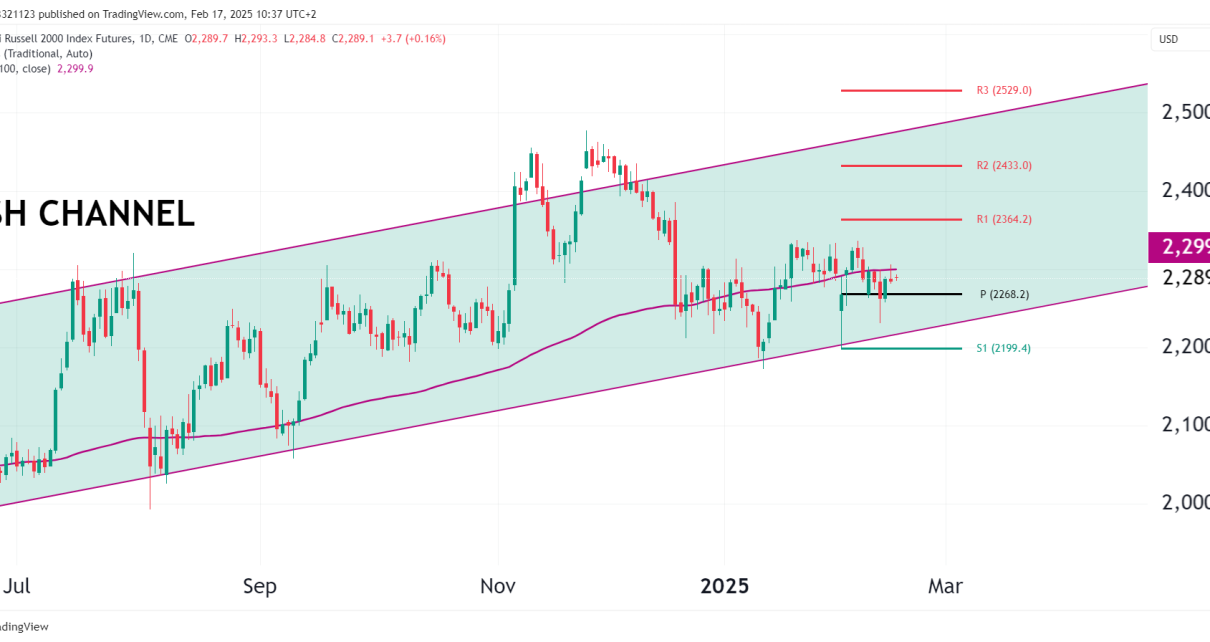
RTY Chart Overview In this analysis, we’ll take a closer look at the daily chart of the E-Mini Russell 2000 Index Futures, focusing on the potential head and shoulders pattern, support zone, and key technical indicators. Head and Shoulders Pattern The chart highlights a possible head and shoulders pattern, which could lead to a bearish Read More…
Tag: russel 2000
Russell 2000 Futures (RTY) Technical Analysis
RTY has refused to break out of its almost two year consolidation even as the bigger indices continue to make new highs. RTY has seriously lagged, is it time for it to catch up and finally break out of the consolidation zone or are we headed right back down? Weekly Chart Bulls need to see Read More…
Russell 2000 Futures (RTY) Technical Outlook
In the global markets, a cautious stance prevails as investors await the release of the U.S. consumer price inflation data for March. This anticipation follows a strong U.S. jobs report last Friday that exceeded expectations, fueling speculation about the Federal Reserve’s interest rate plans. Based on the inflation numbers, today’s news could send RTY higher. Read More…
Technical Analysis for E-Mini Russell 2000 Index Futures:
Russell has been severely lagging the big indices with 1 year performance at 7%, while NQ has posted a 47% increase in the same period. Is it finally time for the small caps to catch up? Weekly Key Levels to Watch on the Weekly: Daily Key Levels to Watch on the Daily: Potential Trades: Always Read More…
Russell 2000 Futures (RTY) Technical Analysis
The last time we looked at RTY was almost a month ago as the price just broke below a support trend line. Now, the market for small caps has lagged behind the large cap stocks. Let’s do some technical analysis and see if we expect this gap to close or grow wider. Support and Resistance Read More…
Russell 2000 Futures (RTY) Facing Critical Support after Breakdown
The Russell 2000 futures (RTY) have diverged strongly from major indices in 2023, with RTY down over 10% year-to-date while benchmarks like the S&P 500 post gains. RTY formed a symmetrical triangle consolidation pattern during most of 2022 that confined prices in a tight range. However, two weeks ago RTY broke decisively to the downside Read More…

