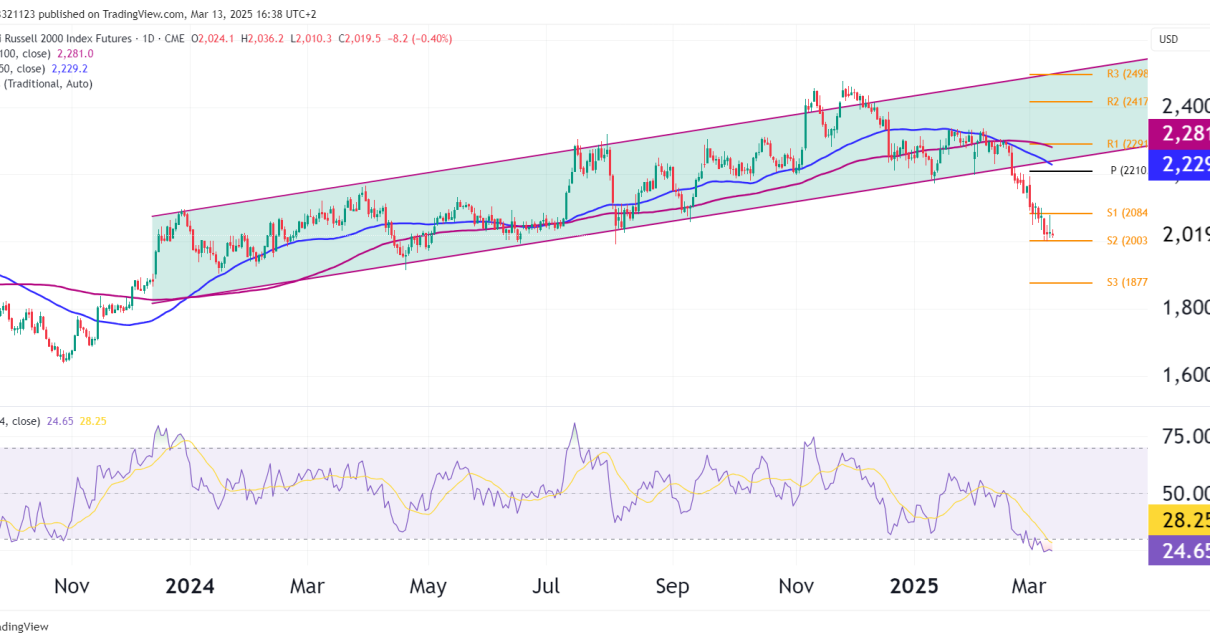
russell 2000 RTY futures OneUp Trader FUnded Trader Program
Technical Analysis

Frightening evening star pattern on RTY futures

Weekly Chart Starting with the weekly chart, the E-Mini Russell 2000 Index Futures are oscillating within a defined trading range between approximately $1964.5 and $2000, with the ATH at $2463.7. The index is currently testing the upper boundary of this range. A convincing breakout above the range could signal a strong bullish sentiment, potentially targeting Read More…

russell 2000 RTY futures OneUp Trader FUnded Trader Program
Technical Analysis

E-Mini Russell 2000 Futures (RTY) Technical Analysis

Introduction The E-Mini Russell 2000 Index Futures are approaching an all-time high (ATH). The technical analysis of both weekly and daily charts are catching up to the bigger indices that have already broken their previous highs. Weekly Chart Analysis On the weekly chart, we see that the RTY futures are within a symmetrical triangle pattern, Read More…

russell 2000 RTY futures OneUp Trader FUnded Trader Program
Technical Analysis

Russell 2000 Futures (RTY) Facing Critical Support after Breakdown

The Russell 2000 futures (RTY) have diverged strongly from major indices in 2023, with RTY down over 10% year-to-date while benchmarks like the S&P 500 post gains. RTY formed a symmetrical triangle consolidation pattern during most of 2022 that confined prices in a tight range. However, two weeks ago RTY broke decisively to the downside Read More…