

What is leading the underperformance?
The Russell 2000 is less weighted in technology stocks compared to the S&P 500 and Nasdaq. Large-cap tech stocks have driven much of the recent market gains, benefiting indices heavily weighted in these sectors.
Small-cap stocks, which dominate the Russell 2000, are more susceptible to economic uncertainties too. In contrast, large-cap stocks generally offer more stability and have shown resilience during economic expansions. During economic recoveries, investors have favored large-cap stocks, particularly in the tech sector. This preference has widened the performance gap between the Russell 2000 and its larger-cap counterparts.
Technical Analysis
Support and Resistance Levels
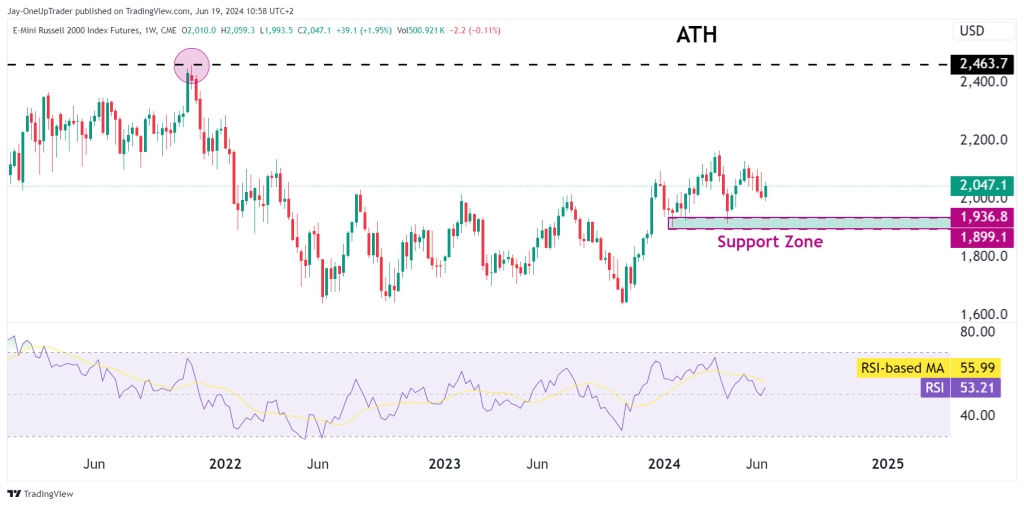
- All-Time High (ATH): The ATH at $2,463.7 is what bulls will be hoping to hit sometime in 2024. Whether we see this will come down to a few factors like rotations from gains in the tech sector to smaller cap stocks.
- Support Zone: The support zone on the chart has provided strong support in the past and is crucial for maintaining the current uptrend. If we see price break below this level, its possible we see prices as low as $1,750. This would probably not occur if big cap stocks continue to rally. If we see NQ and ES begin to drop heavily, its possible RTY makes a bearish move like this.
Trade Opportunities
Long Position
- Entry: Consider entering a long position if the price pulls back to the support zone ($1,899.1 – $1,936.8) and shows signs of a rebound.
- Target: The initial target could be around $2,100, with a longer-term target near the ATH at $2,463.7.
- Stop-Loss: Place a stop-loss below the support zone, around $1,890, to manage risk.
Short Position
- Entry: A short position could be considered if the price breaks below the support zone and major indices begin to fall.